Textbook Question
In Exercises 11 and 12, find the P-value for the hypothesis test with the standardized test statistic z. Decide whether to reject H0 for the level of significance α.
Two-tailed test, z = 2.57, α = 0.10

 Verified step by step guidance
 06:21
06:21 03:33
03:33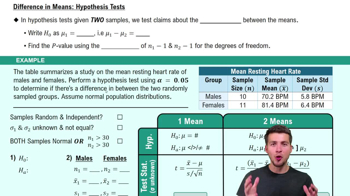 08:24
08:24In Exercises 11 and 12, find the P-value for the hypothesis test with the standardized test statistic z. Decide whether to reject H0 for the level of significance α.
Two-tailed test, z = 2.57, α = 0.10
You want your test to support a positive claim about your college, not just fail to reject one. Should you state your claim so that the null hypothesis contains the claim or the alternate hypothesis contains the claim? Explain.
When you reject a true claim with a level of significance that is virtually zero, what can you infer about the randomness of your sampling process?
n Exercises 1–6, the statement represents a claim. Write its complement and state which is H0 and which is Ha.
σ > 1.9
A research center claims that more than 80% of U.S. adults think that mothers should have paid maternity leave. In a random sample of 50 U.S. adults, 82% think that mothers should have paid maternity leave. At α=0.05, is there enough evidence to support the center’s claim?
A travel analyst says that the mean price of a meal for a family of 4 in a resort restaurant is at most \$100. A random sample of 33 meal prices for families of 4 has a mean of \$110 and a standard deviation of \$19. At α=0.01, is there enough evidence to reject the analyst’s claim?