Textbook Question
(a) Construct a 90% confidence interval for the population mean in Exercise 1. Interpret the results. (b) Does it seem likely that the population mean could be within 10% of the sample mean? Explain.

 Verified step by step guidance
 06:33
06:33 05:11
05:11 04:48
04:48(a) Construct a 90% confidence interval for the population mean in Exercise 1. Interpret the results. (b) Does it seem likely that the population mean could be within 10% of the sample mean? Explain.
In Exercises 27–30, find the critical values and for the level of confidence c and sample size n.
c = 0.95, n = 13
In Exercises 27–30, find the critical values and for the level of confidence c and sample size n.
c = 0.98, n = 25
The data set represents the scores of 12 randomly selected students on the SAT Physics Subject Test. Assume the population test scores are normally distributed and the population standard deviation is 108. (Adapted from The College Board)
d. Determine the minimum sample size required to be 95% confident that the sample mean test score is within 10 points of the population mean test score.
Use the standard normal distribution or the t-distribution to construct the indicated confidence interval for the population mean of each data set. Justify your decision. If neither distribution can be used, explain why. Interpret the results.
b. In a random sample of 15 cereal boxes, the mean weight was 11.89 ounces. Assume the weights of the cereal boxes are normally distributed and the population standard deviation is 0.05 ounce. Construct a 90% confidence interval for the population mean.
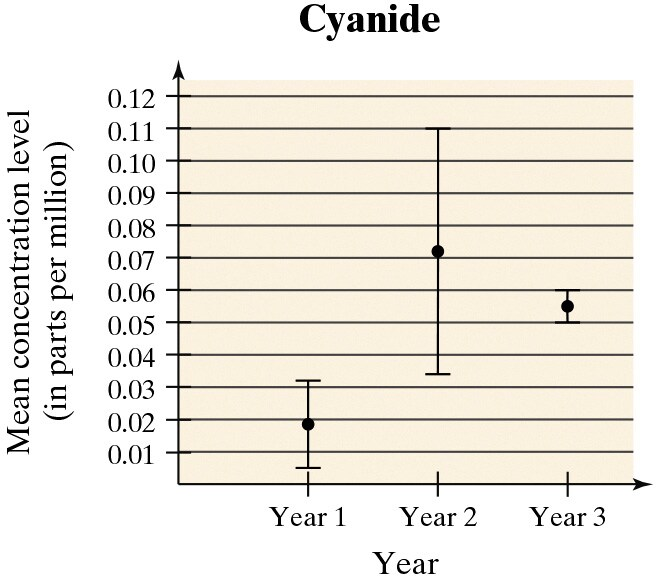
The Safe Drinking Water Act, which was passed in 1974, allows the Environmental Protection Agency (EPA) to regulate the levels of contaminants in drinking water. The EPA requires that water utilities give their customers water quality reports annually. These reports include the results of daily water quality monitoring, which is performed to determine whether drinking water is safe for consumption. A water department tests for contaminants at water treatment plants and at customers’ taps. These contaminants include microorganisms, organic chemicals, and inorganic chemicals, such as cyanide. Cyanide’s presence in drinking water is the result of discharges from steel, plastics, and fertilizer factories. For drinking water, the maximum contaminant level of cyanide is 0.2 parts per million. As part of your job for your city’s water department, you are preparing a report that includes an analysis of the results shown in the figure at the right. The figure shows the point estimates for the population mean concentration and the 95% confidence intervals for cyanide over a three-year period. The data are based on random water samples taken by the city’s three water treatment plants.
The confidence interval for Year 2 is much larger than that for the other years. What do you think may have caused this larger confidence level?