


 08:45
08:45

Textbook Question
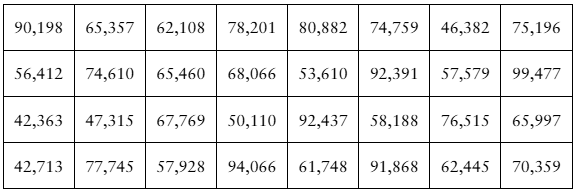
Constructing Confidence Intervals In Exercises 13–24, assume the sample is from a normally distributed population and construct the indicated confidence intervals for (b) the population standard deviation σ. Interpret the results.
Drug Concentration The times (in minutes) for the drug concentration to peak when the drug epinephrine is injected into 15 randomly selected patients are listed. Use a 90% level of confidence.