Textbook Question
Finding Critical Values for χ2 In Exercises 3–8, find the critical values χR2 and χL2 for the level of confidence c and sample size n.
c = 0.98, n = 26

 Verified step by step guidance
 06:33
06:33 04:48
04:48 08:45
08:45Finding Critical Values for χ2 In Exercises 3–8, find the critical values χR2 and χL2 for the level of confidence c and sample size n.
c = 0.98, n = 26
Translating Statements In Exercises 29–34, translate the statement into a confidence interval. Approximate the level of confidence.
In a survey of 1052 parents of children ages 8–14, 68% say they are willing to get a second or part-time job to pay for their children’s college education, and 42% say they lose sleep worrying about college costs. The survey’s margin of error is ±3%. (Source: T. Rowe Price Group, Inc.)
The data set represents the amounts of time (in minutes) spent checking email for a random sample of employees at a company.
c. Repeat part (b), assuming σ = 3.5 minutes. Compare the results.
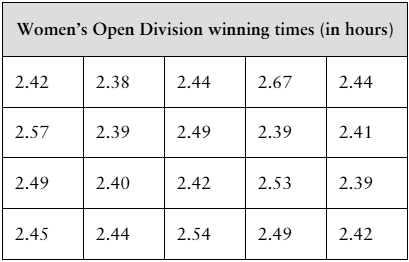
[APPLET] The winning times (in hours) for a sample of 20 randomly selected Boston Marathon Women’s Open Division champions from 1980 to 2019 are shown in the table at the left. Assume the population standard deviation is 0.068 hour. (Source: Boston Athletic Association)
b. Find the margin of error for a 95% confidence level.
You wish to estimate the mean winning time for Boston Marathon Women’s Open Division champions. The estimate must be within 2 minutes of the population mean. Determine the minimum sample size required to construct a 99% confidence interval for the population mean. Use the population standard deviation from Exercise 1.
You research the salaries of senior-level civil engineers and find that the population mean is \$131,935. In Exercise 4, does the t-value fall between -t0.95 and t0.95?