Textbook Question
Finding a z-Score Given an Area In Exercises 23–30, find the indicated z-score.
Find the z-score that has 2.275% of the distribution’s area to its left.

 Verified step by step guidance
 09:47
09:47 06:31
06:31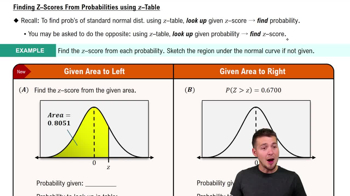 08:50
08:50Finding a z-Score Given an Area In Exercises 23–30, find the indicated z-score.
Find the z-score that has 2.275% of the distribution’s area to its left.
In Exercises 21–24, a control chart is shown. Each chart has horizontal lines drawn at the mean mu, at mu ±2sigma, and at mu±3sigma. Determine whether the process shown is in control or out of control. Explain.
An engine part has been designed to have a diameter of 55 millimeters. The standard deviation of the process is 0.001 millimeter.
Graphical Analysis In Exercises 13–16, a member is selected at random from the population represented by the graph. Find the probability that the member selected at random is from the shaded region of the graph. Assume the variable x is normally distributed.
" style="" width="282">
Finding a z-Score In Exercises 1–16, use the Standard Normal Table or technology to find the z-score that corresponds to the cumulative area or percentile.
P33
True or False? In Exercises 5–8, determine whether the statement is true or false. If it is false, rewrite it as a true statement.
If the sample size is at least 30, then you can use z-scores to determine the probability that a sample mean falls in a given interval of the sampling distribution.
Graphical Analysis In Exercises 11–16, determine whether the graph could represent a variable with a normal distribution. Explain your reasoning. If the graph appears to represent a normal distribution, estimate the mean and standard deviation.