

 06:39
06:39

The Centers for Disease Control and Prevention (CDC) is required by law to publish a report on assisted reproductive technology (ART). ART includes all fertility treatments in which both the egg and the sperm are used. These procedures generally involve removing eggs from a patient’s ovaries, combining them with sperm in the laboratory, and returning them to the patient’s body or giving them to another patient.
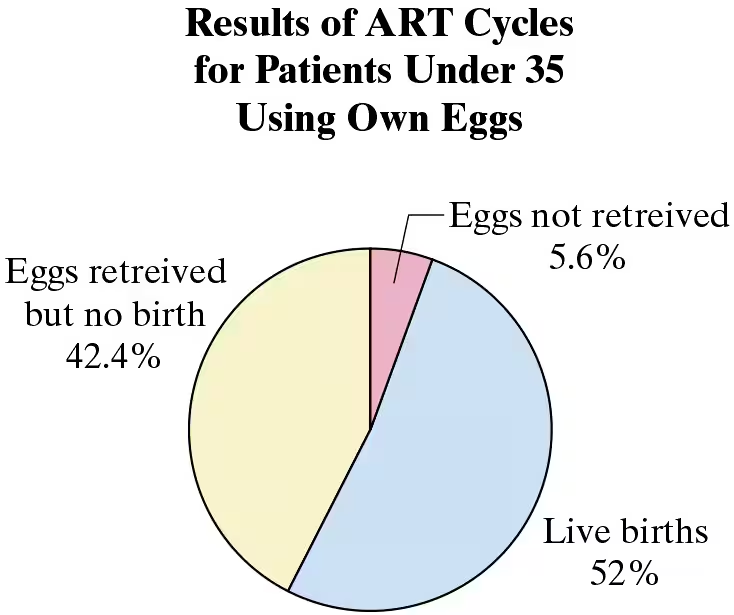
You are helping to prepare a CDC report on young ART patients and select at random 6 ART cycles of patients under 35 years of age for a special review. None of the cycles resulted in a live birth. Your manager feels it is impossible to select at random 10 ART cycles that do not result in a live birth. Use the pie chart at the right and your knowledge of statistics to determine whether your manager is correct.
a. How would you determine whether your manager is correct, that it is impossible to select at random six ART cycles that do not result in a live birth?