Ch. 4 - Discrete Probability Distributions
Larson - Elementary Statistics: Picturing the World 8th Edition
Larson8th EditionElementary Statistics: Picturing the WorldISBN: 9780137493470Not the one you use?Change textbook
Chapter 4, Problem 4.R.7

In Exercises 7 and 8, (a) find the mean, variance, and standard deviation of the probability distribution, and (b) interpret the results.


The number of cell phones per household in a small town
cell

Verified step by step guidance
1
Step 1: To find the mean of the probability distribution, use the formula for the expected value: \( \mu = \sum (x \cdot P(x)) \), where \( x \) represents the number of cell phones and \( P(x) \) represents the corresponding probability. Multiply each \( x \) value by its probability and sum the results.
Step 2: To calculate the variance, use the formula \( \sigma^2 = \sum [(x - \mu)^2 \cdot P(x)] \). First, subtract the mean \( \mu \) from each \( x \) value, square the result, and then multiply by the corresponding probability. Sum these values to get the variance.
Step 3: To find the standard deviation, take the square root of the variance: \( \sigma = \sqrt{\sigma^2} \). This provides a measure of the spread of the distribution.
Step 4: Interpret the mean: The mean represents the average number of cell phones per household in the town. It is a weighted average based on the probabilities provided.
Step 5: Interpret the standard deviation: The standard deviation indicates how much the number of cell phones per household varies from the mean. A smaller standard deviation suggests less variability, while a larger standard deviation indicates more variability.

Verified video answer for a similar problem:

This video solution was recommended by our tutors as helpful for the problem above.
Video duration:
5m
Was this helpful?

Key Concepts

Here are the essential concepts you must grasp in order to answer the question correctly.

Mean of a Probability Distribution

The mean of a probability distribution, also known as the expected value, is calculated by multiplying each outcome by its probability and summing these products. It provides a measure of the central tendency of the distribution, indicating the average number of cell phones per household in this context.
Recommended video:
Guided course
03:28
Mean & Standard Deviation of Binomial Distribution

Variance and Standard Deviation

Variance measures the spread of a probability distribution by calculating the average of the squared differences from the mean. The standard deviation, the square root of the variance, indicates how much the values typically deviate from the mean, providing insight into the variability of cell phone ownership in households.
Recommended video:
Guided course
08:45
Calculating Standard Deviation

Interpreting Results

Interpreting the results involves analyzing the calculated mean, variance, and standard deviation to understand the distribution of cell phones per household. This includes discussing what the average number of cell phones suggests about the community and how the variability reflects differences in cell phone ownership among households.
Recommended video:
07:10
Empirical Rule of Standard Deviation and Range Rule of Thumb
Related Practice
Textbook Question

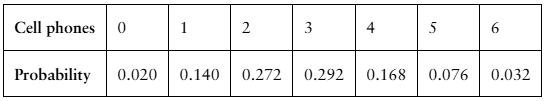
In Exercises 17 and 18, (a) construct a binomial distribution, (b) graph the binomial distribution using a histogram and describe its shape, and (c) identify any values of the random variable x that you would consider unusual. Explain your reasoning.

Seventy-two percent of U.S adults have read a book in any format in the past year. You randomly select five U.S adults and ask them whether they have read a book in any format in the past year. The random variable represents the number of adults who have read a book in any format in the past year. (Source: Pew Research)

1
views
Textbook Question

In Exercises 9 and 10, find the expected net gain to the player for one play of the game.


It costs \(25 to bet on a horse race. The horse has a 1/8 chance of winning and a 1/4 chance of placing second or third. You win \)125 if the horse wins and receive your money back if the horse places second or third.

Textbook Question

In Exercises 21–26, find the indicated probabilities using the geometric distribution, the Poisson distribution, or the binomial distribution. Then determine whether the events are unusual. If convenient, use a table or technology to find the probabilities.

Fourteen percent of noninstitutionalized U.S. adults smoke cigarettes. After randomly selecting ten noninstitutionalized U.S. adults, you ask them whether they smoke cigarettes. Find the probability that the first adult who smokes cigarettes is (b) the fourth or fifth person selected.

1
views
Textbook Question

In Exercises 21–26, find the indicated probabilities using the geometric distribution, the Poisson distribution, or the binomial distribution. Then determine whether the events are unusual. If convenient, use a table or technology to find the probabilities.

Fourteen percent of noninstitutionalized U.S. adults smoke cigarettes. After randomly selecting ten noninstitutionalized U.S. adults, you ask them whether they smoke cigarettes. Find the probability that the first adult who smokes cigarettes is (a) the third person selected.

1
views
Textbook Question

In Exercises 19 and 20, find the mean, variance, and standard deviation of the binomial distribution for the given random variable. Interpret the results and determine any unusual values.

About 13% of U.S. drivers are uninsured. You randomly select eight U.S. drivers and ask them whether they are uninsured. The random variable represents the number who are uninsured. (Source: Insurance Research Council)

1
views
Textbook Question

In Exercises 21–26, find the indicated probabilities using the geometric distribution, the Poisson distribution, or the binomial distribution. Then determine whether the events are unusual. If convenient, use a table or technology to find the probabilities

Thirty-six percent of Americans think there is still a need for the practice of changing their clocks for Daylight Savings Time. You randomly select seven Americans. Find the probability that the number who say there is still a need for changing their clocks for Daylight Savings Time is (a) exactly four

1
views