Ch. 3 - Probability
Larson - Elementary Statistics: Picturing the World 8th Edition
Larson8th EditionElementary Statistics: Picturing the WorldISBN: 9780137493470Not the one you use?Change textbook
Chapter 3, Problem 3.Q.2e

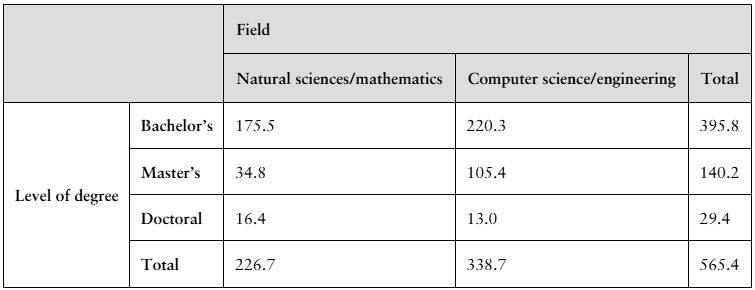
The table shows the numbers (in thousands) of earned degrees by level in two different fields, conferred in the United States in a recent year. (Source: U.S. National Center for Education Statistics)
A person who earned a degree in the year is randomly selected. Find the probability that the degree earned by the person is a
g. bachelor's degree and the degree is in natural sciences/mathematics.
tab

Verified step by step guidance
1
Step 1: Identify the relevant data from the table. The number of bachelor's degrees in natural sciences/mathematics is 175.5 (in thousands), and the total number of degrees conferred across all fields and levels is 565.4 (in thousands).
Step 2: Recall the formula for probability. The probability of an event is calculated as the ratio of the number of favorable outcomes to the total number of outcomes. In this case, the favorable outcome is earning a bachelor's degree in natural sciences/mathematics.
Step 3: Write the probability formula for this scenario: \( P = \frac{\text{Number of bachelor's degrees in natural sciences/mathematics}}{\text{Total number of degrees}} \). Using MathML, this can be expressed as: P=175.5565.4
Step 4: Simplify the fraction to calculate the probability. This involves dividing the numerator (175.5) by the denominator (565.4).
Step 5: Interpret the result. The probability represents the likelihood that a randomly selected person who earned a degree in the year obtained a bachelor's degree in natural sciences/mathematics.

Verified video answer for a similar problem:

This video solution was recommended by our tutors as helpful for the problem above.
Video duration:
2m
Was this helpful?

Key Concepts

Here are the essential concepts you must grasp in order to answer the question correctly.

Probability

Probability is a measure of the likelihood that a particular event will occur, expressed as a number between 0 and 1. In this context, it refers to the chance of randomly selecting a person who earned a bachelor's degree in natural sciences/mathematics from the total number of degrees conferred. Understanding how to calculate probability is essential for answering the question accurately.
Recommended video:
5:37
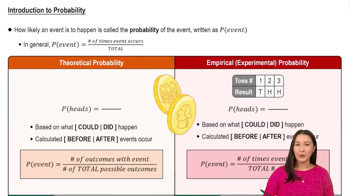
Introduction to Probability

Total Counts

Total counts refer to the sum of all occurrences of a particular category within a dataset. In the table, the total number of degrees conferred in each field and level of degree is crucial for determining the overall probability. For instance, the total number of bachelor's degrees is necessary to find the probability of selecting a bachelor's degree in natural sciences/mathematics.
Recommended video:
04:04
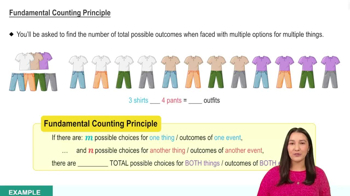
Fundamental Counting Principle

Conditional Probability

Conditional probability is the probability of an event occurring given that another event has already occurred. In this scenario, we are interested in the probability of selecting a bachelor's degree in natural sciences/mathematics, which is a specific condition within the broader context of all degrees. This concept helps in understanding how to narrow down the sample space when calculating probabilities.
Recommended video:
5:37
Introduction to Probability
Related Practice
Textbook Question

The table shows the results of a survey in which 3,545,286 public and 509,168 private school teachers were asked about their full-time teaching experience.

Are the events “being a public school teacher” and “having more than 20 years of full-time teaching experience” independent? Explain.

Textbook Question

6. A shipment of 250 netbooks contains 3 defective units. Determine how many ways a vending company can buy three of these units and receive

c. at least one good unit.

Textbook Question

In Exercises 15-18, determine whether the situation involves permutations, combinations, or neither. Explain your reasoning.

15. The number of ways 16 floats can line up in a row for a parade

Textbook Question

Using a Frequency Distribution to Find Probabilities In Exercises 49-52, use the frequency distribution at the left, which shows the population of the United States by age group, to find the probability that a U.S. resident chosen at random is in the age range. (Source: U.S. Census Bureau)

49. 18 to 24 years old

Textbook Question

The table shows the numbers (in thousands) of earned degrees by level in two different fields, conferred in the United States in a recent year. (Source: U.S. National Center for Education Statistics)

A person who earned a degree in the year is randomly selected. Find the probability that the degree earned by the person is a

a. bachelor's degree.

Textbook Question

The table shows the numbers (in thousands) of earned degrees by level in two different fields, conferred in the United States in a recent year. (Source: U.S. National Center for Education Statistics)

A person who earned a degree in the year is randomly selected. Find the probability that the degree earned by the person is a

g. bachelor's degree and the degree is in natural sciences/mathematics.