Ch. 3 - Probability
Larson - Elementary Statistics: Picturing the World 8th Edition
Larson8th EditionElementary Statistics: Picturing the WorldISBN: 9780137493470Not the one you use?Change textbook
Chapter 3, Problem 3.RE.34

In Exercises 33 and 34, use the pie chart at the left, which shows the percent distribution of the number of students in U.S. public schools in a recent year. (Source: U.S. National Center for Education Statistics)
<IMAGE>
34. Find the probability of randomly selecting a school with 300 or more students.

Verified step by step guidance
1
Identify the relevant categories in the pie chart that represent schools with 300 or more students. These categories are '300–499', '500–999', and '1000 or more'.
Determine the percentage of students in each of these categories from the pie chart: '300–499' is 28.1%, '500–999' is 32.7%, and '1000 or more' is 9.4%.
Add these percentages together to find the total percentage of students in schools with 300 or more students. Use the formula: Total Percentage = Percentage(300–499) + Percentage(500–999) + Percentage(1000 or more).
Convert the total percentage into a probability. Since percentages are out of 100, divide the total percentage by 100 to express it as a probability.
Interpret the result as the probability of randomly selecting a school with 300 or more students.

Verified video answer for a similar problem:

This video solution was recommended by our tutors as helpful for the problem above.
Video duration:
1m
Was this helpful?

Key Concepts

Here are the essential concepts you must grasp in order to answer the question correctly.

Probability

Probability is a measure of the likelihood that a particular event will occur, expressed as a number between 0 and 1. In this context, it refers to the chance of randomly selecting a school with 300 or more students from the total distribution shown in the pie chart.
Recommended video:
5:37
Introduction to Probability

Pie Chart Interpretation

A pie chart visually represents data as slices of a circle, where each slice corresponds to a category's proportion of the whole. Understanding how to read the percentages in the pie chart is essential for determining the probability of selecting a school based on its student population.
Recommended video:
06:10
Creating Pie Charts

Cumulative Distribution

Cumulative distribution refers to the total percentage of observations that fall below a certain value. To find the probability of selecting a school with 300 or more students, one must calculate the cumulative percentage of schools with fewer than 300 students and subtract it from 100%.
Recommended video:
Guided course
06:38
Intro to Frequency Distributions
Related Practice
Textbook Question

"In Exercises 19-22, determine whether the events are independent or dependent. Explain your reasoning.

21. Taking a driver's education course and passing the driver's license exam"

Textbook Question

In Exercises 7-12, classify the statement as an example of classical probability, empirical probability, or subjective probability. Explain your reasoning.

11. The probability of rolling 2 six-sided dice and getting a sum of 9 is 1/9.

Textbook Question

28. A sample of 6500 automobiles found that 1560 of the automobiles were black, 3120 of the automobiles were sedans, and 1170 of the automobiles were black sedans. Find the probability that a randomly chosen automobile from this sample is black or a sedan.

1
views
Textbook Question

In Exercises 5 and 6, use the Fundamental Counting Principle.

6. The state of Virginia's license plates have three letters and four digits. Assuming that any letter or digit can be used, how many different license plates are possible?

Textbook Question

"In Exercises 19-22, determine whether the events are independent or dependent. Explain your reasoning.

20. Selecting an ace from a standard deck of 52 playing cards, and then selecting a jack from the deck without replacing the ace"

Textbook Question

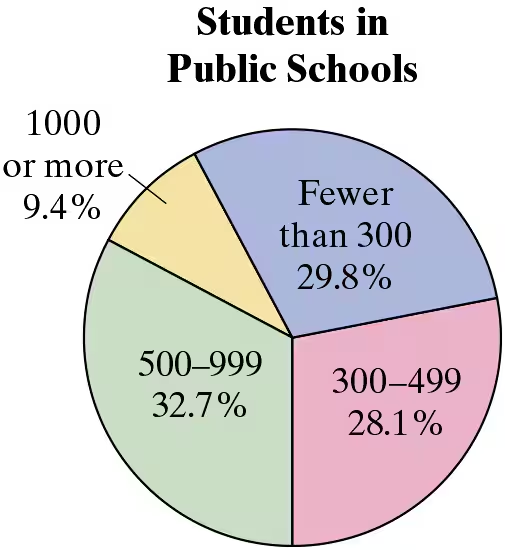
In Exercises 13 and 14, use the table, which shows the approximate distribution of the sizes of firms for a recent year. (Adapted from North American Industry Classification System)

" style="" width="521">

13. Find the probability that a randomly selected firm will have more than four employees.