Ch. 2 - Descriptive Statistics
Larson - Elementary Statistics: Picturing the World 8th Edition
Larson8th EditionElementary Statistics: Picturing the WorldISBN: 9780137493470Not the one you use?Change textbook
Chapter 2, Problem 2.3.52

Finding the Mean of a Frequency Distribution In Exercises 49–52, approximate the mean of the frequency distribution.


Populations The populations (in thousands) of the counties in Montana in 2019 (Source: U.S. Census Bureau)
Table displaying the population ranges in thousands and their corresponding frequencies for counties in Montana, 2019.

Verified step by step guidance
1
Step 1: Identify the midpoints of each population interval. The midpoint is calculated as the average of the lower and upper boundaries of each interval. For example, for the interval 0–19, the midpoint is (0 + 19) / 2 = 9.5.
Step 2: Multiply each midpoint by its corresponding frequency to find the 'weighted total' for each interval. For example, for the interval 0–19, the weighted total is 9.5 * 46.
Step 3: Sum all the weighted totals obtained in Step 2. This gives the total of all midpoints weighted by their frequencies.
Step 4: Sum all the frequencies from the table. This gives the total number of counties.
Step 5: Divide the sum of the weighted totals (from Step 3) by the sum of the frequencies (from Step 4). This quotient is the approximate mean of the frequency distribution.

Verified video answer for a similar problem:

This video solution was recommended by our tutors as helpful for the problem above.
Video duration:
3m
Was this helpful?

Key Concepts

Here are the essential concepts you must grasp in order to answer the question correctly.

Mean of a Frequency Distribution

The mean of a frequency distribution is calculated by multiplying each population midpoint by its corresponding frequency, summing these products, and then dividing by the total number of observations. This provides a weighted average that reflects the distribution of data across different population ranges.
Recommended video:
Guided course
06:38
Intro to Frequency Distributions

Midpoint Calculation

The midpoint of a class interval is found by averaging the lower and upper boundaries of the interval. For example, the midpoint for the population range 0-19 is (0 + 19) / 2 = 9.5. This value is essential for calculating the mean, as it represents a single value for each range that can be used in the mean formula.
Recommended video:
Guided course
06:31
Z-Scores From Given Probability - TI-84 (CE) Calculator

Total Frequency

Total frequency is the sum of all frequencies in a frequency distribution. It represents the total number of observations or data points being analyzed. In this case, it is crucial for determining the denominator when calculating the mean, ensuring that the mean reflects the average population across all counties.
Recommended video:
04:15
Frequency Polygons Example 1
Related Practice
Textbook Question

Finding the Mean of a Frequency Distribution In Exercises 49–52, approximate the mean of the frequency distribution.


Social Media The average daily amounts of time (in minutes) spent on Snapchat

Textbook Question

Finding a Weighted Mean In Exercises 41– 46, find the weighted mean of the data.


Grades A student receives the grades shown below, with an A worth 4 points, a B worth 3 points, a C worth 2 points, and a D worth 1 point. What is the student’s grade point average?


Textbook Question

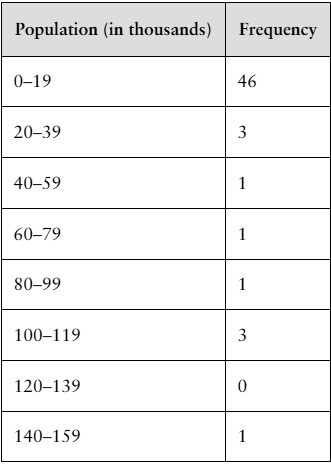
Constructing a Frequency Distribution and a Frequency Polygon In Exercises 35 and 36, construct a frequency distribution and a frequency polygon for the data set using the indicated number of classes. Describe any patterns.

Declaration of Independence

Number of classes: 5

Data set: Number of children of those who signed the Declaration of Independence (Source: The U.S. National Archives & Records Administration) 5 2 12 18 7 4 10 8 16 3 3 7 3 1 2 7 13 0 8 3 7 5 2 6 0 6 7 9 0 11 9 10 7 8 13 5 8 3 5 0 3 13 3 15 5 6 3 2 5 2 0 3 7 12 4 1

Textbook Question

Graphical Analysis In Exercises 19–22, use the box-and-whisker plot to determine whether the shape of the distribution represented is symmetric, skewed left, skewed right, or none of these. Justify your answer.

Textbook Question

Using and Interpreting Concepts


Finding and Discussing the Mean, Median, and Mode In Exercises 17–34, find the mean, the median, and the mode of the data, if possible. If any measure cannot be found or does not represent the center of the data, explain why.


Video Durations The lengths (in minutes) of seven educational videos from the Public Broadcasting Service (PBS) (Source: PBS)

83 67 90 55 56 119 52

Textbook Question

Comparing Variation in Different Data Sets In Exercises 45–50, find the coefficient of variation for each of the two data sets. Then compare the results.

Annual Salaries Sample annual salaries (in thousands of dollars) for entry level architects in Denver, CO, and Los Angeles, CA, are listed.