Textbook Question
Finding the Mean of a Frequency Distribution In Exercises 49–52, approximate the mean of the frequency distribution.
Social Media The average daily amounts of time (in minutes) spent on Snapchat

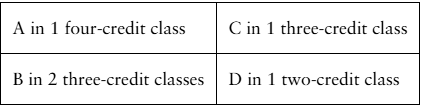
 Verified step by step guidance
 04:52
04:52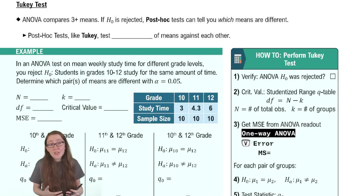 08:22
08:22 02:35
02:35Finding the Mean of a Frequency Distribution In Exercises 49–52, approximate the mean of the frequency distribution.
Social Media The average daily amounts of time (in minutes) spent on Snapchat
What is the difference between a frequency polygon and an ogive?
Finding and Interpreting Percentiles In Exercises 37– 40, use the data set, which represents wait times (in minutes) for various services at a state’s Department of Motor Vehicles locations.
6 10 1 22 23 10 6 7 2 1 6 6 2 4 14 15 16 4
19 3 19 26 5 3 4 7 6 10 9 10 20 18 3 20 10 13
14 11 14 17 4 27 4 8 4 3 26 18 21 1 3 3 5 5
Which wait time represents the 50th percentile? How would you interpret this?
Finding z-Scores The distribution of the ages of the winners of the Tour de France from 1903 to 2020 is approximately bell-shaped. The mean age is 27.9 years, with a standard deviation of 3.4 years. In Exercises 43–48, use the corresponding z-score to determine whether the age is unusual. Explain your reasoning. (Source: Le Tour de France)
Finding the Mean of a Frequency Distribution In Exercises 49–52, approximate the mean of the frequency distribution.
Populations The populations (in thousands) of the counties in Montana in 2019 (Source: U.S. Census Bureau)
Comparing Variation in Different Data Sets In Exercises 45–50, find the coefficient of variation for each of the two data sets. Then compare the results.
Annual Salaries Sample annual salaries (in thousands of dollars) for entry level architects in Denver, CO, and Los Angeles, CA, are listed.