Ch. 2 - Descriptive Statistics
Larson - Elementary Statistics: Picturing the World 8th Edition
Larson8th EditionElementary Statistics: Picturing the WorldISBN: 9780137493470Not the one you use?Change textbook
Chapter 2, Problem 2.3.41

Finding a Weighted Mean In Exercises 41– 46, find the weighted mean of the data.
Final Grade The scores and their percents of the final grade for a statistics student are shown below. What is the student’s mean score?
Table displaying scores and their corresponding percentages of a student's final grade in a statistics course.

Verified step by step guidance
1
Step 1: Understand the concept of weighted mean. The weighted mean is calculated by multiplying each score by its corresponding weight (percentage of the final grade), summing these products, and then dividing by the total weight (which should sum to 100%).
Step 2: Convert the percentages into decimal form for easier calculations. For example, 5% becomes 0.05, 35% becomes 0.35, and so on.
Step 3: Multiply each score by its corresponding weight in decimal form. For example, for Homework: 85 × 0.05, for Quizzes: 80 × 0.35, for Project/Speech: 100 × 0.35, and for Final Exam: 93 × 0.25.
Step 4: Add all the weighted scores together. This sum represents the numerator of the weighted mean formula.
Step 5: Divide the sum of the weighted scores by the total weight (which is 1, since all percentages add up to 100%). This will give the weighted mean of the student's scores.

Verified video answer for a similar problem:

This video solution was recommended by our tutors as helpful for the problem above.
Video duration:
1m
Was this helpful?

Key Concepts

Here are the essential concepts you must grasp in order to answer the question correctly.

Weighted Mean

The weighted mean is a type of average that takes into account the relative importance of each value. Unlike a simple average, where all values contribute equally, the weighted mean assigns different weights to each value based on their significance, often represented as percentages. This is particularly useful in scenarios like calculating final grades, where different assessments contribute differently to the overall score.
Recommended video:
Guided course
04:52
Calculating the Mean

Percentages

Percentages represent a fraction of 100 and are used to express how a part relates to a whole. In the context of the weighted mean, percentages indicate the weight or importance of each score in the overall calculation. Understanding how to convert these percentages into decimal form is crucial for accurately computing the weighted mean.
Recommended video:
06:10
Creating Pie Charts

Calculation of Weighted Mean

To calculate the weighted mean, multiply each score by its corresponding weight (percentage), sum these products, and then divide by the total of the weights. This process ensures that each score contributes to the final mean in proportion to its significance, allowing for a more accurate representation of the student's overall performance based on the different assessments.
Recommended video:
Guided course
04:52
Calculating the Mean
Related Practice
Textbook Question

Building Basic Skills and Vocabulary


The length of a guest lecturer’s talk represents the third quartile for talks in a guest lecture series. Make an observation about the length of the talk.

Textbook Question

Constructing Data Sets In Exercises 5– 8, construct the described data set. The entries in the data set cannot all be the same.


Mean and median are the same and the data is bimodal.

1
views
Textbook Question

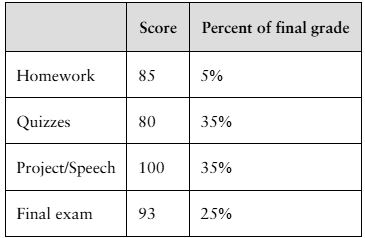
Construct a frequency distribution for the data set using the indicated number of classes. In the table, include the midpoints, relative frequencies, and cumulative frequencies. Which class has the greatest class frequency and which has the least class frequency.

Textbook Spending

Number of classes: 6

Data set: Amounts (in dollars) spent on textbooks for a semester 91 472 279 249 530 376 188 341 266 199 142 273 189 130 489 266 248 101 375 486 190 398 188 269 43 30 127 354 84 319

1
views
Textbook Question

Using and Interpreting Concepts


Finding and Discussing the Mean, Median, and Mode In Exercises 17–34, find the mean, the median, and the mode of the data, if possible. If any measure cannot be found or does not represent the center of the data, explain why.


Weights (in pounds) of Packages on a Delivery Truck

" style="" width="380">

Textbook Question

Interpreting Percentiles In Exercises 29–32, use the ogive, which represents the cumulative frequency distribution for quantitative reasoning scores on the Graduate Record Examination in a recent range of years. (Adapted from Educational Testing Service)

What score represents the 65th percentile? How should you interpret this?

1
views
Textbook Question

Determine whether the statement is true or false. If it is false, rewrite it as a true statement.

Class boundaries ensure that consecutive bars of a histogram touch.