Textbook Question
Which part of the survey described in Exercise 31 represents the descriptive branch of statistics? What conclusions might be drawn from the survey using inferential statistics?
7
views

 Verified step by step guidance
 05:11
05:11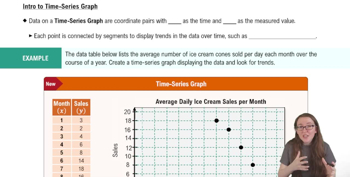 04:13
04:13 05:53
05:53Which part of the survey described in Exercise 31 represents the descriptive branch of statistics? What conclusions might be drawn from the survey using inferential statistics?
"Identify the sampling technique used, and discuss potential sources of bias (if any). Explain.
After a hurricane, a disaster area is divided into 200 equal grids. Thirty of the grids are selected, and every occupied household in the grid is interviewed to help focus relief efforts on what residents require the most."
Determine the level of measurement of the data listed on the horizontal and vertical axes in the figure.
Name each level of measurement for which data can be qualitative.
Determine whether the data are qualitative or quantitative, and determine the level of measurement of the data set.
The top six final scores at the 2021 U.S. Women’s Figure Skating Championships are listed. (Source: NBC Sports)
232.61 215.33 214.98 213.39 199.95 178.89
Determine whether the data are qualitative or quantitative. Explain your reasoning.
Ages of dogs at a rescue facility