Skip to main content
Statistics
My Course
Learn
Exam Prep
AI Tutor
Study Guides
Textbook Solutions
Flashcards
Explore
Try the app
My Course
Learn
Exam Prep
AI Tutor
Study Guides
Textbook Solutions
Flashcards
Explore
Try the app
Back
One-Way ANOVA - Excel definitions
You can tap to flip the card.
ANOVA
You can tap to flip the card.
👆
ANOVA
A statistical method for comparing means across three or more groups using variance analysis to detect significant differences.
Track progress
Control buttons has been changed to "navigation" mode.
1/15
Related flashcards
Related practice
Recommended videos
One-Way ANOVA - Excel quiz
One-Way ANOVA - Excel
15 Terms
Multiple Comparisons: Tukey Test
14. ANOVA
5 problems
Topic
14. ANOVA - Part 1 of 2
4 topics
12 problems
Chapter
Ally
14. ANOVA - Part 2 of 2
1 topic
3 problems
Chapter
Justin
Guided course
05:52
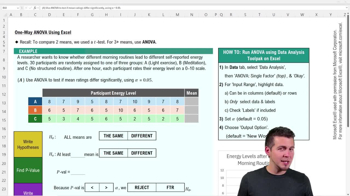
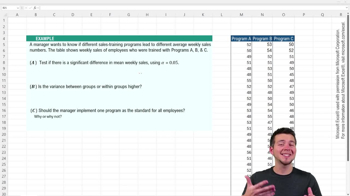
One-Way ANOVA Using Excel Example 1
3
views
Guided course
07:05
One-Way ANOVA Using Excel
3
views
Terms in this set (15)
Hide definitions
ANOVA
A statistical method for comparing means across three or more groups using variance analysis to detect significant differences.
Null Hypothesis
The assumption that all group means are equal, serving as the starting point for statistical testing in variance analysis.
Alternative Hypothesis
The proposition that at least one group mean differs from the others, indicating a significant difference in the data.
F Statistic
A value calculated as the ratio of mean square between groups to mean square within groups, used to assess group differences.
P Value
A probability measure indicating the likelihood of observing the data if the null hypothesis is true; a low value suggests significance.
Alpha
A threshold for statistical significance, commonly set at 0.05, used to decide whether to reject the null hypothesis.
Mean Square Between
A measure of variance reflecting how much group averages differ from the overall mean in variance analysis.
Mean Square Within
A measure of variance showing how much individual values within each group deviate from their group mean.
Data Analysis Tool Pack
An Excel feature providing statistical tools, including ANOVA, for analyzing datasets and generating test statistics.
Input Range
The selection of data in Excel that specifies which values are included in the statistical analysis.
Output Option
A setting in Excel determining where the results of the statistical analysis will be displayed or stored.
Source of Variation
Categories in ANOVA output that distinguish between variance due to group differences and variance within groups.
Group Mean
The average value calculated for each group in a dataset, used to compare differences in ANOVA.
Variance Between Groups
A measure of how much the group means differ from each other, central to detecting significant differences.
Variance Within Groups
A measure of how much individual data points in each group differ from their respective group mean.
 BackBack
 05:52
05:52