Skip to main content
Statistics
My Course
Learn
Exam Prep
AI Tutor
Study Guides
Textbook Solutions
Flashcards
Explore
Try the app
My Course
Learn
Exam Prep
AI Tutor
Study Guides
Textbook Solutions
Flashcards
Explore
Try the app
Back
Non-Standard Normal Distribution definitions
You can tap to flip the card.
Standard Normal Distribution
You can tap to flip the card.
👆
Standard Normal Distribution
A bell-shaped curve centered at zero with a spread of one, used as a reference for probability calculations.
Track progress
Control buttons has been changed to "navigation" mode.
1/15
Related flashcards
Related practice
Recommended videos
Non-Standard Normal Distribution quiz
Non-Standard Normal Distribution
15 Terms
Non-Standard Normal Distribution
6. Normal Distribution and Continuous Random Variables
5 problems
Topic
Laura
6. Normal Distribution and Continuous Random Variables
4 topics
12 problems
Chapter
Justin
Guided course
06:21
Finding Z-Scores for Non-Standard Normal Variables Example 1
1
views
Guided course
04:05
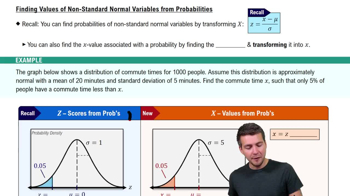
Finding Values of Non-Standard Normal Variables from Probabilities
Guided course
03:17
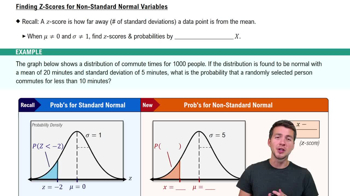
Finding Z-Scores for Non-Standard Normal Variables
Terms in this set (15)
Hide definitions
Standard Normal Distribution
A bell-shaped curve centered at zero with a spread of one, used as a reference for probability calculations.
Nonstandard Normal Distribution
A bell-shaped curve with any mean and standard deviation, requiring transformation for standard analysis.
Mean
The central value around which data points cluster in a normal distribution, often denoted by the Greek letter mu.
Standard Deviation
A measure of spread indicating how much data points deviate from the mean, commonly represented by sigma.
Z-Score
A value expressing how many standard deviations a data point is from the mean, enabling comparison across distributions.
Probability
The likelihood that a random variable falls within a specified range, often visualized as area under the curve.
Z-Table
A reference chart listing probabilities associated with z-scores, used to find areas under the standard normal curve.
Transformation Equation
A formula converting a nonstandard variable to a z-score, allowing use of standard normal tools for analysis.
Bell Curve
A graphical representation of a normal distribution, symmetric and centered around the mean.
Area Under the Curve
A visual measure representing probability for a range of values in a normal distribution.
Commute Time
An example of a real-world variable modeled by a normal distribution, used to illustrate probability calculations.
Sampling Data
A collection of observed values from a population, often used to estimate distribution parameters.
X Value
A specific data point in a distribution, often calculated from a given probability using transformation formulas.
Population
The entire set of individuals or items under study, from which sampling data is drawn.
Left Tail
The portion of a normal distribution curve representing values less than a specified point, often used in probability calculations.
 BackBack
 06:21
06:21