Skip to main content
Statistics
My Course
Learn
Exam Prep
AI Tutor
Study Guides
Textbook Solutions
Flashcards
Explore
Try the app
My Course
Learn
Exam Prep
AI Tutor
Study Guides
Textbook Solutions
Flashcards
Explore
Try the app
Back
Mode definitions
You can tap to flip the card.
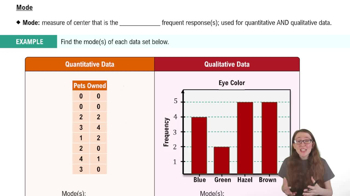
Mode
You can tap to flip the card.
👆
Mode
Identifies the most frequent value or category in a dataset, highlighting the response that appears most often.
Track progress
Control buttons has been changed to "navigation" mode.
1/14
Related flashcards
Related practice
Recommended videos
Mode quiz #1
Mode
10 Terms
Mode
3. Describing Data Numerically
5 problems
Topic
Zachary
Standard Deviation
3. Describing Data Numerically
7 problems
Topic
Jonathan
3. Describing Data Numerically - Part 1 of 2
5 topics
15 problems
Chapter
David-Paige
3. Describing Data Numerically - Part 2 of 2
3 topics
9 problems
Chapter
Jonathan
03:20
Mode
2
views
Terms in this set (14)
Hide definitions
Mode
Identifies the most frequent value or category in a dataset, highlighting the response that appears most often.
Measure of Center
Summarizes a dataset by indicating a central or typical value, aiding in understanding overall data trends.
Quantitative Data
Consists of numerical values, allowing for counting and calculation of frequencies for each response.
Qualitative Data
Composed of categories or labels, where frequency is determined by tallying occurrences of each category.
Frequency
Represents how often a particular value or category appears within a dataset.
Bar Chart
Visualizes categorical data, with bar heights indicating the frequency of each category.
Unimodal
Describes a dataset with only one value or category occurring most frequently.
Bimodal
Refers to a dataset where two values or categories share the highest frequency.
Multimodal
Characterizes a dataset with more than two values or categories tied for highest frequency.
Central Tendency
Describes the tendency of data to cluster around a central value, providing insight into typical responses.
Data Table
Organizes responses in rows or columns, facilitating counting and identification of frequent values.
Category
Represents a distinct group or label within qualitative data, used to classify responses.
Tie
Occurs when two or more values or categories share the highest frequency in a dataset.
Modal
Relates to the number of modes present in a dataset, indicating its frequency distribution.
 BackBack

 03:20
03:20