- Download the worksheet to save time writing
- Start solving the practice problems
- If you're stuck, watch the video solutions
- See your summary to get more insights

A study recorded the time (in minutes) spent on daily exercise by a group of 50 individuals. The collected data was summarized into the following frequency distribution:

Compute the mean of the data summarized in the frequency distribution.
Compare the computed mean to the actual mean obtained from the original list of data values, which is 31.2 minutes.
A study found a linear correlation between the number of household appliances and the monthly electricity usage. The relationship is modeled by the regression equation , where represents the number of household appliances, and represents the predicted monthly electricity usage in kilowatt-hours (). What is the predicted electricity usage for a home with appliances?
A group of hobbyists recorded the number of minutes they spent gardening on a given day. The data collected is grouped into the following frequency distribution:
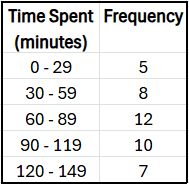
Approximate the mean number of minutes spent gardening.
Listed below are the number of books borrowed from a library by individuals.
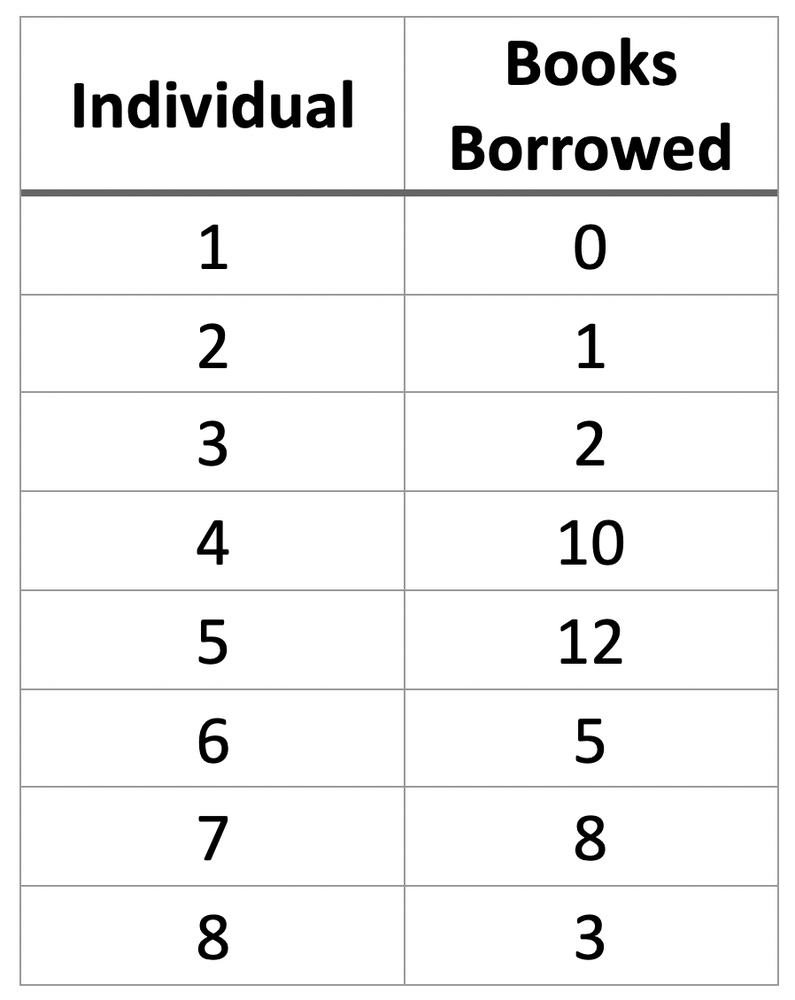
a. What is the mean of the number of books borrowed?
b. What is the median of the number of books borrowed?
The following are the systolic blood pressure readings (in ) for a group of patients:
, , , , , , , , , .
Find the mean, median, and mode of the data. If any measure cannot be found or does not represent the center of the data, explain why.
The times (in minutes) it took nine students to complete a quiz are , , , , , , , , and . What are the mean and median times?
A student's math test score is converted into a z-score. Which of the following z-scores would the student prefer: ?
A college surveyed students about the number of books they read for leisure in a semester. The results are grouped as follows:
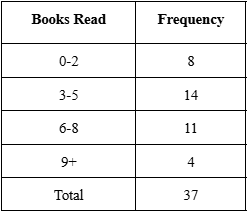
Estimate the sample mean and sample standard deviation. Use as the midpoint for the ' books' group.
The number of hours five employees worked in a week is as follows: , , , , . What is the sample standard deviation of the hours worked? Use the formula .
Use the given data to create a boxplot and determine the 5-number summary.
The following data represent the delay times (in minutes) for a sample of departing flights from a major international airport.
Refer to the scatterplot given below:
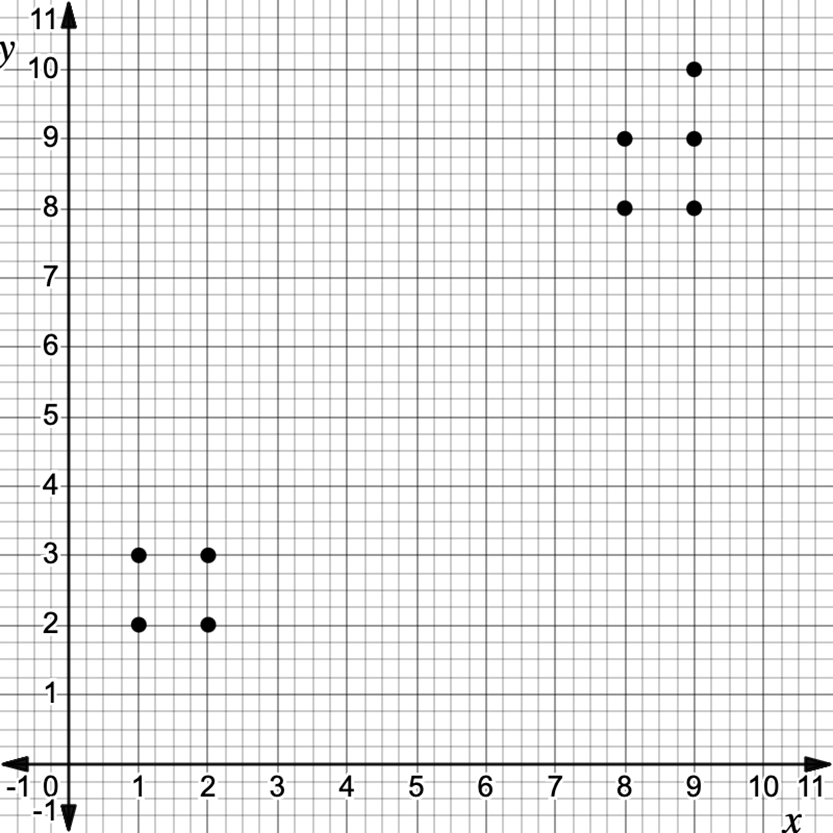
Determine the linear correlation coefficient for the given set of points. What does its value indicate about the relationship between x and y?
A survey records the number of hours students spent on their English essay: , , , , and . Using this data, find the mean, median, range, standard deviation, and describe the shape of the distribution.
Use the data below to calculate the mean, median, and mode of daily screen time. Then, determine whether each measure appropriately represents the central tendency of the data. If any measure is not applicable or does not accurately reflect the data's center, explain why.
Daily screen time (in hours) recorded for a sample of high school students:
, , , , , , , , , , , , ,
Which of the following is the best formal definition of the statistical mode?
Based on the given graph, which measure of central tendency best represents the data?