3. Describing Data Numerically / Describing Data Numerically Using a Graphing Calculator / Problem 11
Problem 11
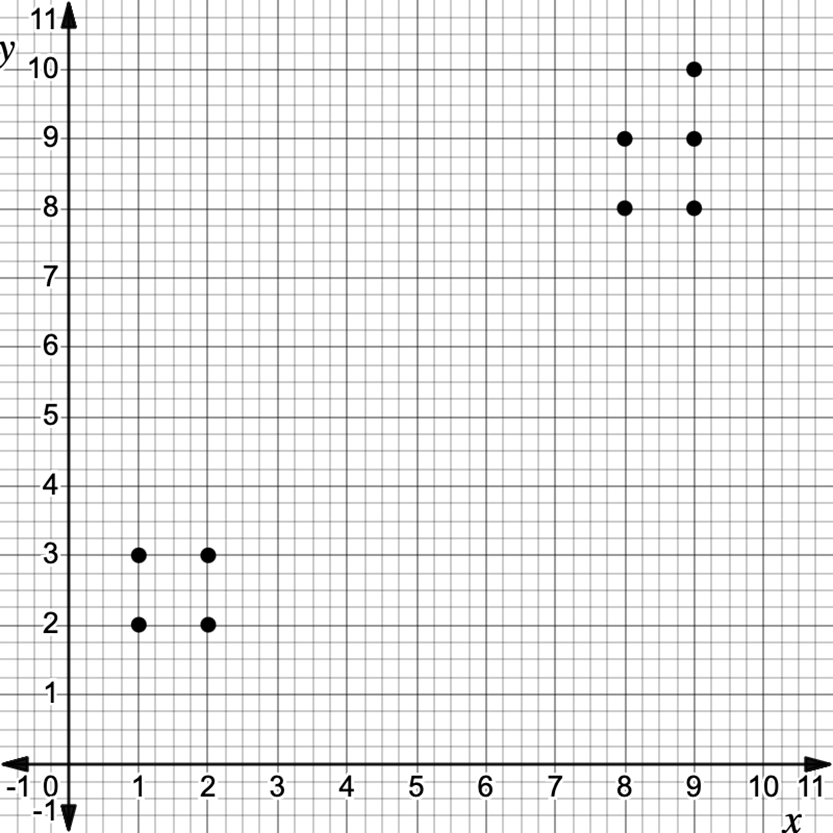
Refer to the scatterplot given below: Determine the linear correlation coefficient for the given set of points. What does its value indicate about the relationship between x and y?