Skip to main content
Statistics
My Course
Learn
Exam Prep
AI Tutor
Study Guides
Textbook Solutions
Flashcards
Explore
Try the app
My Course
Learn
Exam Prep
AI Tutor
Study Guides
Textbook Solutions
Flashcards
Explore
Try the app
Back
Inferences for the Correlation Coefficient - Excel quiz
You can tap to flip the card.
What does the sample correlation coefficient r indicate about the relationship between two variables?
You can tap to flip the card.
👆
What does the sample correlation coefficient r indicate about the relationship between two variables?
If r is close to zero, there is weak or no linear correlation; if r is far from zero, there is strong linear correlation.
Track progress
Control buttons has been changed to "navigation" mode.
1/15
Related flashcards
Related practice
Recommended videos
Inferences for the Correlation Coefficient - Excel definitions
Inferences for the Correlation Coefficient - Excel
15 Terms
11. Correlation
2 topics
4 problems
Chapter
Zachary
05:45
Inferences for Correlation Coefficient - Excel
1
views
05:40
Inferences for Correlation Coefficient - Excel Example 1
4
views
Terms in this set (15)
Hide definitions
What does the sample correlation coefficient r indicate about the relationship between two variables?
If r is close to zero, there is weak or no linear correlation; if r is far from zero, there is strong linear correlation.
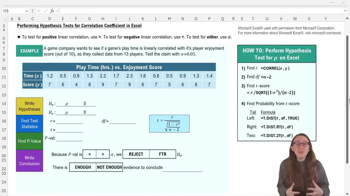
What is the null hypothesis when testing for the population correlation coefficient ρ?
The null hypothesis is that ρ equals zero, indicating no linear correlation between the variables.
How do you determine the sign for the alternative hypothesis in a correlation test?
The sign depends on the claim: use '>' for positive correlation, '<' for negative, and '≠' if testing for any linear correlation.
What is the formula for degrees of freedom in a correlation coefficient hypothesis test?
Degrees of freedom is calculated as n - 2, where n is the sample size.
Which Excel function is used to calculate the sample correlation coefficient r?
The function is =CORREL(x_data, y_data).
What is the formula for the t statistic in a correlation coefficient hypothesis test?
The t statistic is t = r / sqrt((1 - r^2) / (n - 2)).
How do you calculate the p-value for a two-tailed correlation test in Excel?
Use the function =T.DIST.2T(t_score, degrees_of_freedom).
What does a p-value less than alpha (α) indicate in a correlation coefficient hypothesis test?
It means you reject the null hypothesis and conclude there is significant linear correlation.
If the p-value is greater than alpha, what is the conclusion regarding the null hypothesis?
You fail to reject the null hypothesis, indicating insufficient evidence for linear correlation.
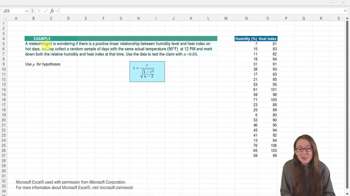
What is the sample size in the example provided for testing correlation in Excel?
The sample size is 13.
What was the calculated sample correlation coefficient r in the example?
The calculated r was approximately 0.74.
What was the calculated t score in the example for the correlation test?
The t score was about 3.68.
What was the calculated p-value in the example, and how did it compare to alpha?
The p-value was about 0.004, which is less than the alpha of 0.05.
What conclusion was reached in the example after comparing the p-value to alpha?
The null hypothesis was rejected, indicating significant linear correlation between playtime and enjoyment score.
What is the purpose of hypothesis testing for the population correlation coefficient ρ?
It evaluates whether a linear relationship observed in sample data is significant enough to extend to the population.
 BackBack
 05:45
05:45