Skip to main content
Statistics
My Course
Learn
Exam Prep
AI Tutor
Study Guides
Textbook Solutions
Flashcards
Explore
Try the app
My Course
Learn
Exam Prep
AI Tutor
Study Guides
Textbook Solutions
Flashcards
Explore
Try the app
Back
Goodness of Fit Test - Excel quiz
You can tap to flip the card.
What is the null hypothesis in a goodness-of-fit test for candy flavors?
You can tap to flip the card.
👆
What is the null hypothesis in a goodness-of-fit test for candy flavors?
The null hypothesis is that the observed frequencies match the claimed distribution, meaning the flavors are evenly distributed.
Track progress
Control buttons has been changed to "navigation" mode.
1/15
Related flashcards
Related practice
Recommended videos
Goodness of Fit Test - Excel definitions
Goodness of Fit Test - Excel
15 Terms
Introduction to Contingency Tables
13. Chi-Square Tests & Goodness of Fit
3 problems
Topic
13. Chi-Square Tests & Goodness of Fit
4 topics
5 problems
Chapter
04:24
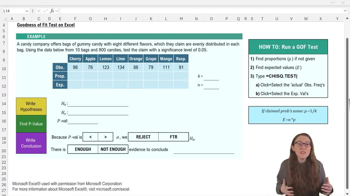
Goodness of FIt Test - Excel Example 1
1
views
05:54
Goodness of FIt Test - Excel
1
views
Terms in this set (15)
Hide definitions
What is the null hypothesis in a goodness-of-fit test for candy flavors?
The null hypothesis is that the observed frequencies match the claimed distribution, meaning the flavors are evenly distributed.
How do you calculate the expected frequency for each category in Excel?
Multiply the total sample size n by the category proportion p for each category.
What Excel function is used to find the p-value in a goodness-of-fit test?
The CHISQ.TEST function is used to calculate the p-value.
What are the two inputs required for the CHISQ.TEST function in Excel?
The actual range (observed frequencies) and the expected range (expected frequencies) are required.
How do you determine the category proportion for an even distribution in Excel?
Divide 1 by the number of categories (k) to get the proportion for each category.
What does it mean if the p-value is less than the significance level alpha?
If the p-value is less than alpha, you reject the null hypothesis.
How can you quickly find the total sample size n in Excel if it’s not given?
Use the SUM function to add up the observed frequencies.
What is the alternative hypothesis in a goodness-of-fit test for candy flavors?
The alternative hypothesis is that the observed frequencies do not match the claimed distribution, meaning flavors are not evenly distributed.
What is the significance level (alpha) used in the example provided?
The significance level used is 0.05.
How do you copy formulas across multiple cells in Excel for category proportions?
Use control c, control v to copy, or click and drag the solid black cross in the bottom right corner of the cell.
What is the formula for expected value in a goodness-of-fit test?
Expected value = n (total sample size) × p (category proportion).
What should you do after calculating the p-value in a goodness-of-fit test?
Compare the p-value to the significance level alpha to decide whether to reject the null hypothesis.
What result did the example yield for the p-value in the Excel goodness-of-fit test?
The p-value was about 0.00008.
What conclusion is drawn if the p-value is much smaller than alpha in the test?
There is enough evidence to conclude that the alternative hypothesis is true, so flavors are not evenly distributed.
Why is Excel helpful for performing goodness-of-fit tests?
Excel automates calculations for expected values and provides functions to quickly obtain the p-value, making the process efficient.
 BackBack
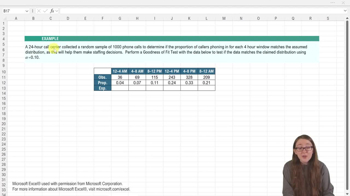
 04:24
04:24