Skip to main content
Statistics
My Course
Learn
Exam Prep
AI Tutor
Study Guides
Textbook Solutions
Flashcards
Explore
Try the app
My Course
Learn
Exam Prep
AI Tutor
Study Guides
Textbook Solutions
Flashcards
Explore
Try the app
Back
Goodness of Fit Test - Excel definitions
You can tap to flip the card.
Goodness of Fit Test
You can tap to flip the card.
👆
Goodness of Fit Test
Statistical procedure for comparing observed frequencies to a claimed distribution across categories.
Track progress
Control buttons has been changed to "navigation" mode.
1/15
Related flashcards
Related practice
Recommended videos
Goodness of Fit Test - Excel quiz
Goodness of Fit Test - Excel
15 Terms
Introduction to Contingency Tables
13. Chi-Square Tests & Goodness of Fit
3 problems
Topic
13. Chi-Square Tests & Goodness of Fit
4 topics
5 problems
Chapter
04:24
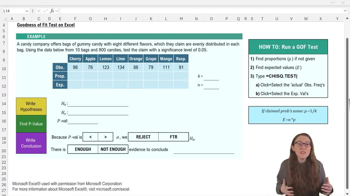
Goodness of FIt Test - Excel Example 1
1
views
05:54
Goodness of FIt Test - Excel
1
views
Terms in this set (15)
Hide definitions
Goodness of Fit Test
Statistical procedure for comparing observed frequencies to a claimed distribution across categories.
Null Hypothesis
Assumption that observed frequencies align with the claimed distribution, serving as the default statement.
Alternative Hypothesis
Statement suggesting observed frequencies differ from the claimed distribution, opposing the null hypothesis.
Observed Frequencies
Counts recorded for each category in a sample, representing actual data collected.
Expected Frequencies
Calculated values for each category based on sample size and claimed proportions, used for comparison.
Category Proportion
Fraction representing the claimed probability for each category, often found by dividing one by the number of categories.
Sample Size
Total number of items or observations included in the analysis, denoted as n.
Significance Level
Threshold, often denoted as alpha, used to determine whether to reject the null hypothesis.
p-value
Probability measure from the test indicating how likely observed data would occur if the null hypothesis were true.
CHISQ.TEST Function
Excel tool for calculating the p-value by comparing observed and expected frequencies.
Claimed Distribution
Assumed pattern or spread of frequencies across categories, used as a reference in hypothesis testing.
Hypothesis Testing
Framework for making decisions about population parameters based on sample data and statistical evidence.
Alpha
Preset probability threshold for significance, commonly set at 0.05 in statistical tests.
Category
Distinct group or type within a dataset, such as flavors in a candy bag.
Even Distribution
Situation where all categories have equal proportions or frequencies, often the basis for the null hypothesis.
 BackBack
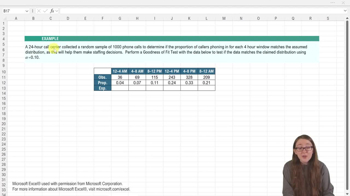
 04:24
04:24