Skip to main content
Statistics
My Course
Learn
Exam Prep
AI Tutor
Study Guides
Textbook Solutions
Flashcards
Explore
Try the app
My Course
Learn
Exam Prep
AI Tutor
Study Guides
Textbook Solutions
Flashcards
Explore
Try the app
Back
Boxplots definitions
You can tap to flip the card.
Box Plot
You can tap to flip the card.
👆
Box Plot
A visual summary of quantitative data using a box and whiskers to display the five-number summary.
Track progress
Control buttons has been changed to "navigation" mode.
1/15
Related flashcards
Related practice
Recommended videos
Boxplots quiz #1
Boxplots
10 Terms
Boxplots
3. Describing Data Numerically
5 problems
Topic
Brendan
3. Describing Data Numerically - Part 1 of 2
5 topics
15 problems
Chapter
David-Paige
3. Describing Data Numerically - Part 2 of 2
3 topics
9 problems
Chapter
Jonathan
01:52
Boxplots Example 1
1
views
02:48
Boxplots Example 2
1
views
03:54
Boxplots ("Box and Whisker Plots")
2
views
Terms in this set (15)
Hide definitions
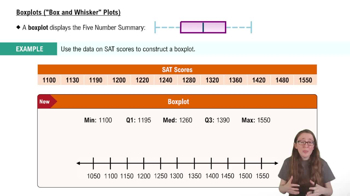
Box Plot
A visual summary of quantitative data using a box and whiskers to display the five-number summary.
Five-Number Summary
A set of values including minimum, first quartile, median, third quartile, and maximum, used to describe data distribution.
Minimum
The smallest value in a dataset, marking the lower end of the box plot's whisker.
Maximum
The largest value in a dataset, marking the upper end of the box plot's whisker.
First Quartile
A value below which 25% of the data falls, also known as Q1 or the 25th percentile.
Third Quartile
A value below which 75% of the data falls, also known as Q3 or the 75th percentile.
Median
The middle value of a dataset, dividing it into two equal halves and marking the 50th percentile.
Interquartile Range
The distance between the first and third quartiles, representing the middle 50% of the data.
Whisker
A line extending from the box to the minimum or maximum, showing the spread outside the interquartile range.
Percentile
A measure indicating the relative position of a value within a dataset, such as 25th, 50th, or 75th.
Number Line
A scale used beneath the box plot to accurately mark the five-number summary values.
Data Spread
The extent to which values in a dataset are dispersed, visually indicated by the length of the box and whiskers.
Central Tendency
A characteristic describing the center of a dataset, often highlighted by the median in a box plot.
Quartile
A division of data into four equal parts, with Q1 and Q3 marking the boundaries of the box in a box plot.
Scale
A reference for ensuring accurate placement and proportionality of values in a box plot.
 BackBack
 01:52
01:52