6. Normal Distribution and Continuous Random Variables
Probabilities & Z-Scores w/ Graphing Calculator
6. Normal Distribution and Continuous Random Variables
Probabilities & Z-Scores w/ Graphing Calculator Bonus
 07:09
07:09

Practice this topic
- Multiple Choice
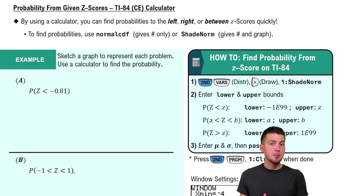
Sketch a graph to represent the probability, then use a calculator to find it.
1views - Multiple Choice
Use a calculator to find the z–scores of the region shown in the standard normal distribution below.
A = 0.800
- Multiple Choice
Which of the following statements is true about a z-score?
1views - Multiple Choice
Suppose a normal distribution is shown on a graph with the mean marked at the center. If a point is marked one standard deviation above the mean, which value best represents the -score of that point?
1views