Describing Data Numerically Using a Graphing Calculator
3. Describing Data Numerically / Describing Data Numerically Using a Graphing Calculator / Problem 4
Problem 4
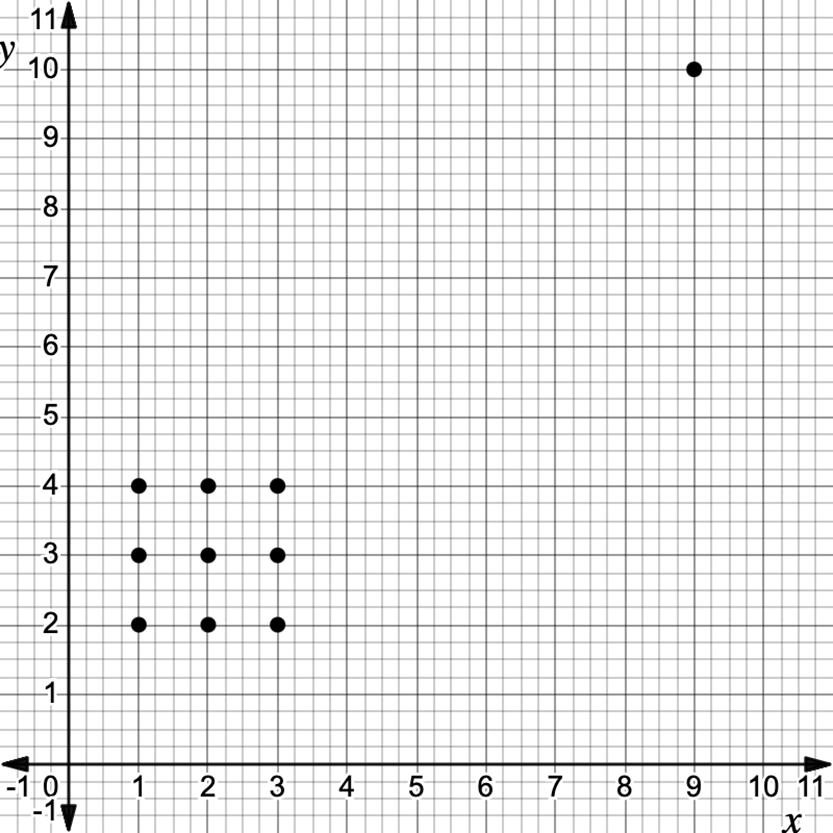
Refer to the scatterplot provided below: After identifying the data points represented in the scatterplot, calculate the correlation coefficient (). Based on the value of , determine whether there is a linear correlation between the two variables.