Ch. 5 - Discrete Probability Distributions
Triola - Elementary Statistics 14th Edition
Triola14th EditionElementary StatisticsISBN: 9780137366446Not the one you use?Change textbook
Chapter 5, Problem 5.RE.8

Family/Partner Groups of people aged 15–65 are randomly selected and arranged in groups of six. The random variable x is the number in the group who say that their family and/or partner contribute most to their happiness (based on a Coca-Cola survey). The accompanying table lists the values of x along with their corresponding probabilities. Does the table describe a probability distribution? If so, find the mean and standard deviation.


Table showing x values 0-6 with probabilities: 0+, 0.003, 0.025, 0.111, 0.279, 0.373, 0.208.

Verified step by step guidance
1
Step 1: Verify if the table describes a probability distribution. To do this, check two conditions: (a) All probabilities P(x) must be between 0 and 1, inclusive, and (b) The sum of all probabilities P(x) must equal 1.
Step 2: Calculate the sum of all probabilities P(x) from the table: \( P(0) + P(1) + P(2) + P(3) + P(4) + P(5) + P(6) \). Ensure the sum equals 1 to confirm it is a valid probability distribution.
Step 3: To find the mean (expected value), use the formula \( \mu = \sum [x \cdot P(x)] \), where \( x \) is the value of the random variable and \( P(x) \) is its corresponding probability. Multiply each \( x \) by its \( P(x) \), then sum the results.
Step 4: To find the variance, use the formula \( \sigma^2 = \sum [(x - \mu)^2 \cdot P(x)] \). Subtract the mean \( \mu \) from each \( x \), square the result, multiply by \( P(x) \), and sum these values.
Step 5: To find the standard deviation, take the square root of the variance: \( \sigma = \sqrt{\sigma^2} \). This provides the measure of spread for the probability distribution.

Verified video answer for a similar problem:

This video solution was recommended by our tutors as helpful for the problem above.
Video duration:
3m
Was this helpful?

Key Concepts

Here are the essential concepts you must grasp in order to answer the question correctly.

Probability Distribution

A probability distribution describes how the probabilities are distributed over the values of a random variable. For a valid probability distribution, the sum of all probabilities must equal 1, and each individual probability must be between 0 and 1. In this case, we need to check if the probabilities listed for the values of x (0 to 6) meet these criteria.
Recommended video:
Guided course
06:39
Calculating Probabilities in a Binomial Distribution

Mean of a Probability Distribution

The mean, or expected value, of a probability distribution is calculated by multiplying each value of the random variable by its corresponding probability and then summing these products. This provides a measure of the central tendency of the distribution, indicating the average outcome one can expect if the experiment is repeated many times.
Recommended video:
Guided course
03:28
Mean & Standard Deviation of Binomial Distribution

Standard Deviation of a Probability Distribution

The standard deviation measures the dispersion or spread of a probability distribution around its mean. It is calculated by taking the square root of the variance, which is the average of the squared differences between each value and the mean, weighted by their probabilities. A higher standard deviation indicates greater variability in the outcomes.
Recommended video:
Guided course
08:45
Calculating Standard Deviation
Related Practice
Textbook Question

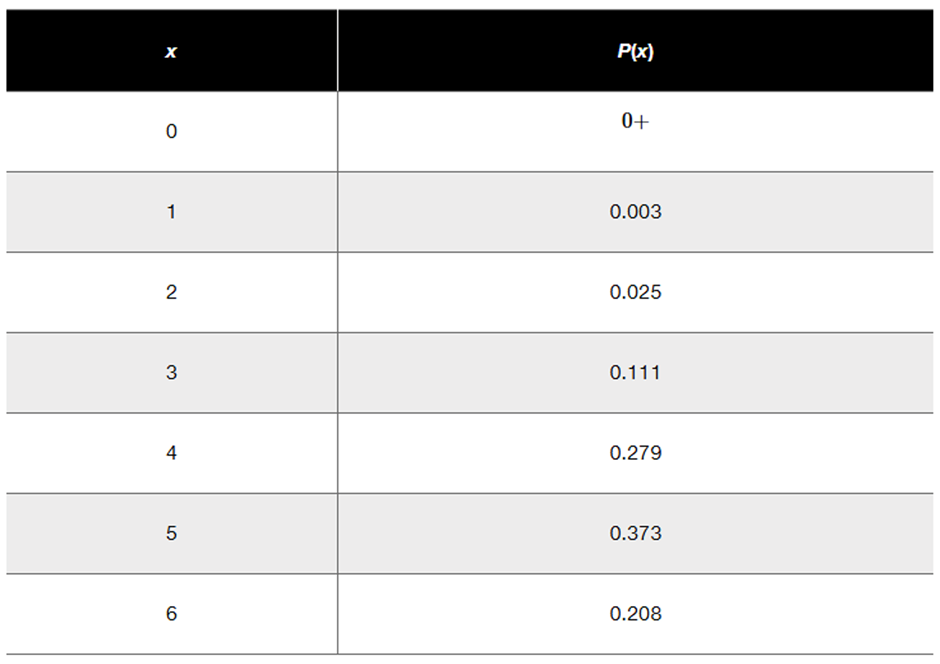
Poisson: Deaths Currently, an average of 7 residents of the village of Westport (population 760) die each year (based on data from the U.S. National Center for Health Statistics).


b. Find the probability that on a given day, there are no deaths.

Textbook Question

In Exercises 9–16, use the Poisson distribution to find the indicated probabilities.


Births In a recent year (365 days), NYU-Langone Medical Center had 5942 births.


a. Find the mean number of births per day.

Textbook Question

In Exercises 1–5, assume that 4.2% of workers test positive when tested for illegal drugs (based on data from Quest Diagnostics). Assume that a group of ten workers is randomly selected.


Workplace Drug Testing If four of the ten workers test positive for illegal drugs, is that a significantly high result?

1
views
Textbook Question

In Exercises 5–8, assume that the Poisson distribution applies; assume that the mean number of Atlantic hurricanes in the United States is 5.5 per year, as in Example 1; and proceed to find the indicated probability.

a. Find the probability that in a year, there will be 10 hurricanes.

Textbook Question

Acrophobia USA Today reported results from a survey in which subjects were asked if they are afraid of heights in tall buildings. The results are summarized in the accompanying table. Does this table describe a probability distribution? Why or why not?

1
views
Textbook Question

In Exercises 5–8, assume that the Poisson distribution applies; assume that the mean number of Atlantic hurricanes in the United States is 5.5 per year, as in Example 1; and proceed to find the indicated probability.

a. Find the probability that in a year, there will be no hurricanes.