Ch. 12 - Analysis of Variance
Triola - Elementary Statistics 14th Edition
Triola14th EditionElementary StatisticsISBN: 9780137366446Not the one you use?Change textbook
Chapter 12, Problem 12.1.18c

Bonferroni Test Shown below are weights (kg) of poplar trees obtained from trees planted in a rich and moist region. The trees were given different treatments identified in the table below. The data are from a study conducted by researchers at Pennsylvania State University and were provided by Minitab, Inc. Also shown are partial results from using the Bonferroni test with the sample data.

c. Use the Bonferroni test procedure with a 0.05 significance level to test for a significant difference between the mean amount of the irrigation treatment group and the group treated with both fertilizer and irrigation. Identify the test statistic and either the P-value or critical values. What do the results indicate?
Table showing Bonferroni test results comparing treatments with mean differences, standard errors, significance, and confidence intervals.

Verified step by step guidance
1
Step 1: Identify the two treatment groups to compare. Here, we are comparing the 'Irrigation' group (treatment 3) and the 'Fertilizer and Irrigation' group (treatment 4).
Step 2: Locate the mean difference between these two groups from the Bonferroni test table. The mean difference is given as -0.84400, which represents the difference in average weights between the 'Irrigation' group and the 'Fertilizer and Irrigation' group.
Step 3: Note the standard error associated with this mean difference, which is 0.26955. This value measures the variability of the difference estimate.
Step 4: Check the significance value (Sig.) for this comparison, which is 0.039. This is the P-value used to determine if the difference is statistically significant at the 0.05 significance level.
Step 5: Interpret the results: Since the P-value (0.039) is less than the significance level (0.05), we reject the null hypothesis that there is no difference between the two treatment means. The 95% confidence interval for the mean difference is from -1.6549 to -0.0331, which does not include zero, further supporting a significant difference.

Verified video answer for a similar problem:

This video solution was recommended by our tutors as helpful for the problem above.
Video duration:
2m
Was this helpful?

Key Concepts

Here are the essential concepts you must grasp in order to answer the question correctly.

Bonferroni Test

The Bonferroni test is a multiple comparison procedure used after an ANOVA to control the overall Type I error rate when making pairwise comparisons. It adjusts the significance level by dividing it by the number of comparisons, ensuring that the probability of making one or more false discoveries remains low. This test helps identify which specific group means differ significantly.
Recommended video:
Guided course
06:28
Independence Test

Test Statistic and P-value

The test statistic measures the difference between group means relative to the variability in the data. The P-value indicates the probability of observing such a difference if the null hypothesis is true. In the Bonferroni test, comparing the test statistic to critical values or the P-value to the adjusted significance level determines if the difference is statistically significant.
Recommended video:
Guided course
06:50
Step 3: Get P-Value

Confidence Intervals in Multiple Comparisons

Confidence intervals in the Bonferroni test are adjusted to maintain the overall confidence level across multiple comparisons. These intervals provide a range of plausible values for the difference between group means. If the interval does not include zero, it suggests a significant difference between the groups at the chosen significance level.
Recommended video:
06:33
Introduction to Confidence Intervals
Related Practice
Textbook Question

Interaction


b. In general, when using two-way analysis of variance, if we find that there is an interaction effect, how does that affect the procedure?


Textbook Question

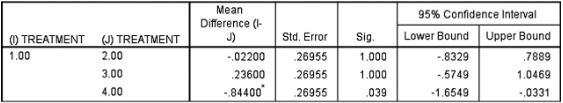
In Exercises 1–4, use the following listed measured amounts of chest compression (mm) from car crash tests (from Data Set 35 “Car Data” in Appendix B). Also shown are the SPSS results from analysis of variance. Assume that we plan to use a 0.05 significance level to test the claim that the different car sizes have the same mean amount of chest compression.


Anova


b. If the objective is to test the claim that the four car sizes have the same mean chest compression, why is the method referred to as analysis of variance?

Textbook Question

Transformations of Data Example 1 illustrated the use of two-way ANOVA to analyze the sample data in Table 12-3. How are the results affected in each of the following cases?


b. Each sample value is multiplied by the same nonzero constant.

Textbook Question

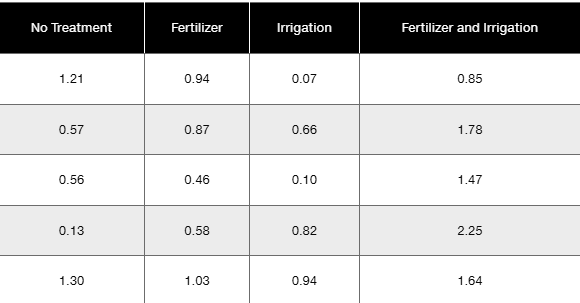
In Exercises 1–5, refer to the following list of numbers of years that deceased U.S. presidents, popes, and British monarchs lived after their inauguration, election, or coronation, respectively. (As of this writing, the last president is George H. W. Bush, the last pope is John Paul II, and the last British monarch is George VI.) Assume that the data are samples from larger populations.


[Image]


Exploring the Data Include appropriate units in all answers.


d. Are there any obvious outliers?

Textbook Question

c. Shown below is an interaction graph constructed from the data in Exercise 1. What does the graph suggest?

Textbook Question

Transformations of Data Example 1 illustrated the use of two-way ANOVA to analyze the sample data in Table 12-3. How are the results affected in each of the following cases?


c. The format of the table is transposed so that the row and column factors are interchanged.