Ch. 2 - Descriptive Statistics
Larson - Elementary Statistics: Picturing the World 8th Edition
Larson8th EditionElementary Statistics: Picturing the WorldISBN: 9780137493470Not the one you use?Change textbook
Chapter 2, Problem 2.5.1

Building Basic Skills and Vocabulary


The length of a guest lecturer’s talk represents the third quartile for talks in a guest lecture series. Make an observation about the length of the talk.

Verified step by step guidance
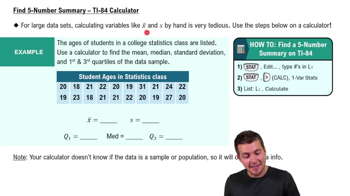
1
Understand the concept of the third quartile (Q3): The third quartile is the value that separates the top 25% of the data from the bottom 75%. In other words, 75% of the data values are less than or equal to Q3, and 25% are greater than Q3.
Interpret the problem: The length of the guest lecturer's talk is given as the third quartile. This means that 75% of the talks in the guest lecture series are shorter than or equal to the length of this talk.
Make an observation: Since the length of the talk represents Q3, it is longer than at least 75% of the other talks in the series. This indicates that the talk is relatively long compared to most other talks in the series.
Relate this to the data distribution: The third quartile is a measure of position in the data set. If the data is skewed or has outliers, the interpretation of Q3 might vary slightly, but it still represents the 75th percentile.
Conclude: The length of the guest lecturer's talk is a benchmark for the upper 25% of the data, making it a significant point of comparison for the other talks in the series.

Verified video answer for a similar problem:

This video solution was recommended by our tutors as helpful for the problem above.
Video duration:
1m
Was this helpful?

Key Concepts

Here are the essential concepts you must grasp in order to answer the question correctly.

Quartiles

Quartiles are statistical values that divide a dataset into four equal parts, each containing 25% of the data. The third quartile (Q3) specifically represents the value below which 75% of the data falls. Understanding quartiles helps in analyzing the distribution of data, particularly in identifying outliers and the spread of values.
Recommended video:
Guided course
04:51
Find 5-Number Summary - TI-84 Calculator

Descriptive Statistics

Descriptive statistics summarize and describe the main features of a dataset. This includes measures such as mean, median, mode, and quartiles, which provide insights into the central tendency and variability of the data. In the context of the guest lecturer's talk, descriptive statistics can help contextualize the length of the talk relative to others in the series.
Recommended video:
Guided course
05:53
Parameters vs. Statistics

Data Distribution

Data distribution refers to how values are spread or arranged in a dataset. It can be visualized through graphs like histograms or box plots, which illustrate the frequency of data points across different ranges. Observing the length of the talk in relation to the overall distribution of talk lengths can reveal whether it is typical, unusually long, or short compared to other lectures.
Recommended video:
Guided course
04:39
Visualizing Qualitative vs. Quantitative Data
Related Practice
Textbook Question

Finding a Weighted Mean In Exercises 41– 46, find the weighted mean of the data.

Final Grade The scores and their percents of the final grade for a statistics student are shown below. What is the student’s mean score?

Textbook Question

Interpreting Percentiles In Exercises 29–32, use the ogive, which represents the cumulative frequency distribution for quantitative reasoning scores on the Graduate Record Examination in a recent range of years. (Adapted from Educational Testing Service)

What score represents the 65th percentile? How should you interpret this?

1
views
Textbook Question

Determine whether the statement is true or false. If it is false, rewrite it as a true statement.

Class boundaries ensure that consecutive bars of a histogram touch.

Textbook Question

Using Technology to Find Quartiles and Draw Graphs In Exercises 23–26, use technology to draw a box-and-whisker plot that represents the data set.


Hourly Earnings The hourly earnings (in dollars) of a sample of 21 employees at a consulting firm

25.89 27.09 31.76 28.28 26.19 27.43 24.06

25.61 22.56 29.76 18.01 23.66 38.24 37.27

32.70 31.12 25.87 15.06 23.12 30.62 19.85

1
views
Textbook Question

Finding a Weighted Mean In Exercises 41– 46, find the weighted mean of the data.

Credit Card Balance For the month of October, a credit card has a balance of \$115.63 for 12 days, \$637.19 for 6 days, \$1225.06 for 7 days, \$0 for 2 days, and \$34.88 for 4 days. What is the account’s mean daily balance for October?

Textbook Question

Using and Interpreting Concepts


Finding and Discussing the Mean, Median, and Mode In Exercises 17–34, find the mean, the median, and the mode of the data, if possible. If any measure cannot be found or does not represent the center of the data, explain why.


College Credits The number of credits being taken by a sample of 14 full-time college students for a semester

12 14 16 15 13 14 15

18 16 16 12 16 15 17