Textbook Question
Interaction
a. What is an interaction between two factors?

 Verified step by step guidance
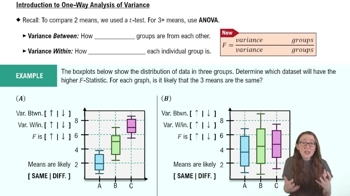
 06:46
06:46 06:28
06:28 05:52
05:52Interaction
a. What is an interaction between two factors?
Transformations of Data Example 1 illustrated the use of two-way ANOVA to analyze the sample data in Table 12-3. How are the results affected in each of the following cases?
a. The same constant is added to each sample value.
Birth Weights The table below lists some of the same data used in the preceding exercise, but the seven days of the week are combined into weekday (Monday, Tuesday, Wednesday, Thursday, Friday) and weekend days (Saturday, Sunday). Also, the birth weights are converted to kilograms. What do you conclude?
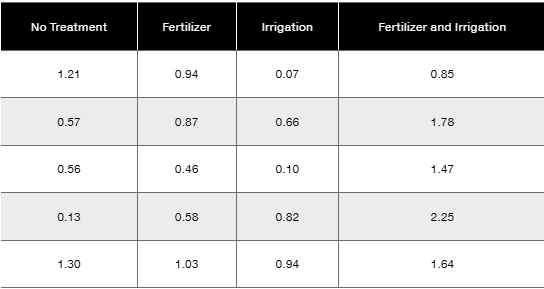
Bonferroni Test Shown below are weights (kg) of poplar trees obtained from trees planted in a rich and moist region. The trees were given different treatments identified in the table below. The data are from a study conducted by researchers at Pennsylvania State University and were provided by Minitab, Inc. Also shown are partial results from using the Bonferroni test with the sample data.
b. What do the displayed Bonferroni SPSS results tell us?
In Exercises 1–4, use the following listed measured amounts of chest compression (mm) from car crash tests (from Data Set 35 “Car Data” in Appendix B). Also shown are the SPSS results from analysis of variance. Assume that we plan to use a 0.05 significance level to test the claim that the different car sizes have the same mean amount of chest compression.
Anova
a. What characteristic of the data above indicates that we should use one-way analysis of variance?
Birth Weights Data Set 6 “Births” includes birth weights (g), hospitals, and the day of the week that mothers were admitted to the hospital. Using rows to represent the four hospitals (Albany Medical Center, Bellevue Hospital Center, Olean General Hospital, Strong Memorial Hospital), and using columns to represent the seven different days of the week, a two-way table has 28 individual cells. Using five birth weights for each of those 28 cells and using StatCrunch for two-way analysis of variance, we get the results displayed below. What do you conclude?