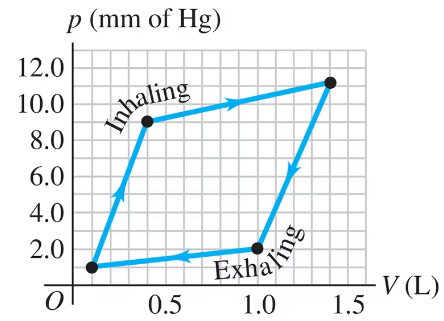
Ch 19: The First Law of Thermodynamics
Young & Freedman Calc - University Physics 15th Edition
Young & Freedman Calc15th EditionUniversity PhysicsISBN: 9780135159552Not the one you use?Change textbook
Chapter 19, Problem 4a

The graph in Fig. E19.419.4 shows a pVpV-diagram of the air in a human lung when a person is inhaling and then exhaling a deep breath. Such graphs, obtained in clinical practice, are normally somewhat curved, but we have modeled one as a set of straight lines of the same general shape. (Important: The pressure shown is the gauge pressure, not the absolute pressure.) How many joules of net work does this person's lung do during one complete breath?
Graph of lung pV diagram with straight lines showing inhaling and exhaling phases, pressure in mm Hg, volume in liters.

Verified step by step guidance
1
Step 1: Understand the problem. The graph represents a pressure-volume (pV) diagram for the air in a human lung during one complete breath cycle (inhaling and exhaling). The goal is to calculate the net work done by the lung during this cycle. Work in a pV diagram is given by the area enclosed by the curve.
Step 2: Convert the units of pressure and volume to SI units. Pressure is given in mmHg, and volume is given in liters. Convert pressure to pascals using the relation: 1 mmHg = 133.322 Pa. Convert volume to cubic meters using the relation: 1 L = 0.001 m³.
Step 3: Break the graph into segments. The graph consists of straight lines forming a closed loop. Identify the coordinates of the vertices of the loop in terms of pressure and volume, and calculate the work done for each segment using the formula for work: \( W = \int p \, dV \). For straight lines, this simplifies to \( W = p \cdot \Delta V \) if pressure is constant, or the area under the line if pressure varies linearly.
Step 4: Calculate the net work done. The net work is the sum of the work done during inhaling and exhaling. Since the graph forms a closed loop, the net work corresponds to the area enclosed by the loop. Use the formula for the area of a trapezoid or divide the loop into simpler geometric shapes (e.g., triangles and rectangles) to calculate the enclosed area.
Step 5: Interpret the result. The net work done by the lung during one complete breath is equal to the area enclosed by the loop in the pV diagram, expressed in joules. Ensure all calculations are consistent with SI units.

Verified video answer for a similar problem:

This video solution was recommended by our tutors as helpful for the problem above.
Was this helpful?

Key Concepts

Here are the essential concepts you must grasp in order to answer the question correctly.

pV Diagram

A pV diagram, or pressure-volume diagram, visually represents the relationship between the pressure (p) and volume (V) of a gas. In this context, it illustrates the changes in pressure and volume during the inhalation and exhalation phases of breathing. The area enclosed by the curve on the diagram corresponds to the work done by the lungs during these processes.
Recommended video:
Guided course
08:07
Work and PV Diagrams

Work Done by a Gas

The work done by a gas during expansion or compression can be calculated using the area under the curve in a pV diagram. For a closed system, this work is defined as the integral of pressure with respect to volume. In the case of the lungs, the net work done during one complete breath is the difference between the work done during inhalation and exhalation.
Recommended video:
Guided course
03:47
Calculating Work Done on Monoatomic Gas

Gauge Pressure vs. Absolute Pressure

Gauge pressure is the pressure relative to atmospheric pressure, while absolute pressure includes atmospheric pressure in its measurement. In the context of the lung pV diagram, it is crucial to note that the pressures shown are gauge pressures, which affects the calculations of work done. Understanding this distinction is essential for accurately interpreting the graph and calculating the net work.
Recommended video:
Guided course
09:27
Pressure Gauges: Barometer
Related Practice
Textbook Question

A gas undergoes two processes. In the first, the volume remains constant at 0.2000.200 m3 and the pressure increases from 2.00×1052.00\(\times\)10^5 Pa to 5.00×1055.00\(\times\)10^5 Pa. The second process is a compression to a volume of 0.1200.120 m3 at a constant pressure of 5.00×1055.00\(\times\)10^5 Pa. Find the total work done by the gas during both processes.

1
views
Textbook Question

Two moles of an ideal gas are heated at constant pressure from T=27T = 27°C to T=107T = 107°C. Calculate the work done by the gas.

1
views
Textbook Question

The graph in Fig. E19.419.4 shows a pVpV-diagram of the air in a human lung when a person is inhaling and then exhaling a deep breath. Such graphs, obtained in clinical practice, are normally somewhat curved, but we have modeled one as a set of straight lines of the same general shape. (Important: The pressure shown is the gauge pressure, not the absolute pressure.) The process illustrated here is somewhat different from those we have been studying, because the pressure change is due to changes in the amount of gas in the lung, not to temperature changes. (Think of your own breathing. Your lungs do not expand because they've gotten hot.) If the temperature of the air in the lung remains a reasonable 20 20°C, what is the maximum number of moles in this person's lung during a breath?

1
views
Textbook Question

Two moles of an ideal gas are heated at constant pressure from T=27T = 27°C to T=107T = 107°C. Draw a pVpV-diagram for this process.

1
views
Textbook Question

A gas undergoes two processes. In the first, the volume remains constant at 0.2000.200 m3 and the pressure increases from 2.00×1052.00\(\times\)10^5 Pa to 5.00×1055.00\(\times\)10^5 Pa. The second process is a compression to a volume of 0.1200.120 m3 at a constant pressure of 5.00×1055.00\(\times\)10^5 Pa. In a pVpV-diagram, show both processes.

2
views
Textbook Question

Six moles of an ideal gas are in a cylinder fitted at one end with a movable piston. The initial temperature of the gas is 27.027.0°C and the pressure is constant. As part of a machine design project, calculate the final temperature of the gas after it has done 2.40×1032.40\(\times\)10^3 J of work.