Textbook Question
FIGURE EX39.16 shows the wave function of an electron. Draw a graph of |ψ(x)|2.

 Verified step by step guidance
 08:30
08:30 11:43 08:30
FIGURE EX39.16 shows the wave function of an electron. Draw a graph of |ψ(x)|2.
What minimum bandwidth is needed to transmit a pulse that consists of 100 cycles of a 1.0 MHz oscillation?
FIGURE EX39.13 shows the probability density for an electron that has passed through an experimental apparatus. What is the probability that the electron will land in a 0.010-mm-wide strip at x = 0.000 mm?
A 1.5-μm-wavelength laser pulse is transmitted through a 2.0-GHz-bandwidth optical fiber. How many oscillations are in the shortest-duration laser pulse that can travel through the fiber?
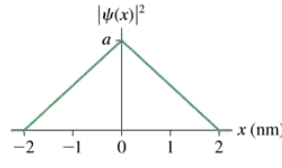
FIGURE EX39.14 is a graph of |ψ(x)|2 for an electron. What is the value of a?
FIGURE EX39.12 shows the probability density for an electron that has passed through an experimental apparatus. If 1.0×10⁶ electrons are used, what is the expected number that will land in a 0.010-mm-wide strip at 2.000 mm?