Textbook Question
FIGURE EX26.8 shows a graph of V versus x in a region of space. The potential is independent of y and z. What is Ex at (a) x=−2 cm, (b) x=0 cm, and (c) x=2 cm?

 Verified step by step guidance
 03:16
03:16 07:33
07:33 07:14
07:14FIGURE EX26.8 shows a graph of V versus x in a region of space. The potential is independent of y and z. What is Ex at (a) x=−2 cm, (b) x=0 cm, and (c) x=2 cm?
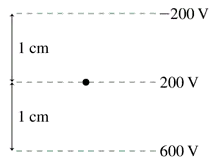
What is the potential difference between A and B?
FIGURE EX26.3 is a graph of Ex. What is the potential difference between xi=1.0 m and xf=3.0 m?
Which point in FIGURE EX26.5, A or B, has a larger electric potential?
A −2.0 V equipotential surface and a +2.0 V equipotential surface are 1.0 mm apart. What is the electric field strength at a point halfway between the two surfaces?
Determine the magnitude and direction of the electric field at points 1 and 2 in FIGURE EX26.9.