Textbook Question
Show that the displacement D(x,t) = ln(ax + bt), where a and b are constants, is a solution to the wave equation. Then find an expression in terms of a and b for the wave speed.
2
views

 Verified step by step guidance
 06:32
06:32 07:32 07:32
The wave speed on a string under tension is 200 m/s. What is the speed if the tension is halved?
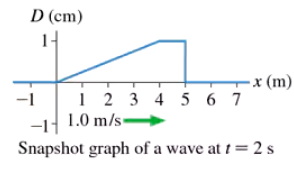
FIGURE EX16.8 is a picture at t = 0 s of the particles in a medium as a longitudinal wave is passing through. The equilibrium spacing between the particles is 1.0 cm. Draw the snapshot graph D(x, t = 0 s) of this wave at t = 0 s.
Show that the displacement D(x,t) = cx² + dt², where c and d are constants, is a solution to the wave equation. Then find an expression in terms of c and d for the wave speed.