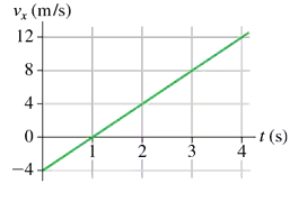
A particle starts from at and moves with the velocity graph shown in FIGURE EX2.6. Does this particle have a turning point? If so, at what time?
Ch 02: Kinematics in One Dimension
Knight Calc5th EditionPhysics for Scientists and EngineersISBN: 9780137344796Not the one you use?Change textbook
Chapter 2, Problem 6b
A particle starts from x0 = 10 m at t0 = 0 s and moves with the velocity graph shown in FIGURE EX2.6. What is the object’s position at t = 2 s and 4 s?

Verified step by step guidance1
Analyze the velocity-time graph provided in the problem. The area under the velocity-time graph represents the displacement of the particle over a given time interval.
Determine the initial position of the particle. If the problem does not specify an initial position, assume it to be zero or a given value.
Break the velocity-time graph into distinct segments (e.g., constant velocity, acceleration, or deceleration) and calculate the area under each segment using appropriate geometric formulas (e.g., rectangle, triangle, or trapezoid).
Sum the areas of all segments from the start time to 4 seconds to find the total displacement of the particle during this time interval.
Add the total displacement to the initial position of the particle to determine its position at 4 seconds.

Verified video answer for a similar problem:
This video solution was recommended by our tutors as helpful for the problem above.
Was this helpful?
Key Concepts
Here are the essential concepts you must grasp in order to answer the question correctly.
Velocity
Velocity is a vector quantity that describes the rate of change of an object's position with respect to time. It includes both the speed of the object and the direction of its motion. Understanding velocity is crucial for determining how far an object travels over a given time interval, especially when analyzing motion graphs.
Recommended video:
Guided course
Escape Velocity
Position Function
The position function describes the location of an object as a function of time. It can be derived from the velocity function by integrating it over time. Knowing the position at specific times, such as 0 seconds and 4 seconds in this case, requires understanding how to apply this integration to the velocity data provided.
Recommended video:
Guided course
Intro to Wave Functions
Integration
Integration is a fundamental concept in calculus that allows us to find the accumulated value of a quantity over an interval. In the context of motion, integrating the velocity function gives us the position function. This process is essential for calculating the position of the particle at specific times based on its velocity graph.
Recommended video:
Guided course
Finding Moment Of Inertia By Integrating
Related Practice
Textbook Question
4
views
Textbook Question
FIGURE EX2.5 shows the position graph of a particle. Draw the particle’s velocity graph for the interval .
3
views
Textbook Question
FIGURE EX2.8 is a somewhat idealized graph of the velocity of blood in the ascending aorta during one beat of the heart. Approximately how far, in cm, does the blood move during one beat?
4
views
Textbook Question
FIGURE EX2.8 showed the velocity graph of blood in the aorta. What is the blood's acceleration during each phase of the motion, speeding up and slowing down?
3
views
Textbook Question
FIGURE EX2.9 shows the velocity graph of a particle. Draw the particle's acceleration graph for the interval 0 s ≤ t ≤ 4 s.
4
views
Textbook Question
FIGURE EX2.4 is the position-versus-time graph of a bicycle. What is the bicycle's velocity at t = 30s?
1
views
