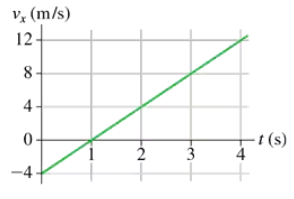
Ch 02: Kinematics in One Dimension
Knight Calc - Physics for Scientists and Engineers 5th Edition
Knight Calc5th EditionPhysics for Scientists and EngineersISBN: 9780137344796Not the one you use?Change textbook
Chapter 2, Problem 6a

A particle starts from at and moves with the velocity graph shown in FIGURE EX2.6. Does this particle have a turning point? If so, at what time?

Verified step by step guidance
1
Step 1: Understand the concept of a turning point. A turning point occurs when the velocity of the particle changes direction, i.e., when the velocity becomes zero and then reverses its sign.
Step 2: Analyze the velocity graph provided. The graph shows the velocity of the particle as a function of time. The velocity starts at 0 m/s, increases to 20 m/s, remains constant, and then decreases back to 0 m/s before becoming negative.
Step 3: Identify the time at which the velocity becomes zero after being positive. From the graph, the velocity decreases linearly and reaches 0 m/s at t = 10 seconds.
Step 4: Check if the velocity becomes negative after t = 10 seconds. The graph shows that the velocity becomes negative after t = 10 seconds, indicating a change in direction.
Step 5: Conclude that the particle has a turning point at t = 10 seconds, as this is the time when the velocity transitions from positive to zero and then to negative.

Verified video answer for a similar problem:

This video solution was recommended by our tutors as helpful for the problem above.
Video duration:
1m
Was this helpful?

Key Concepts

Here are the essential concepts you must grasp in order to answer the question correctly.

Velocity and Turning Points

In physics, a turning point occurs when a particle changes its direction of motion. This is typically indicated by a change in the sign of the velocity. In a velocity-time graph, a turning point is where the velocity crosses the time axis, indicating that the particle has stopped and is about to move in the opposite direction.
Recommended video:
Guided course
08:35
Angular Momentum of a Point Mass

Velocity-Time Graph Interpretation

A velocity-time graph visually represents an object's velocity over time. The slope of the graph indicates acceleration, while the area under the curve represents displacement. In this case, the graph shows a constant velocity followed by a decrease, which suggests that the particle is moving at a steady speed before slowing down, potentially indicating a turning point.
Recommended video:
Guided course
05:59
Velocity-Time Graphs & Acceleration

Constant Velocity

Constant velocity means that an object is moving at a uniform speed in a straight line, with no acceleration. In the provided graph, the particle maintains a velocity of 20 m/s for a period before decreasing. This constant velocity phase indicates that the particle is not experiencing any net forces acting on it, allowing it to move steadily until it begins to decelerate.
Recommended video:
Guided course
08:59
Phase Constant of a Wave Function