Textbook Question
What is each compound's systematic name?
b.
1
views
 Verified step by step guidance
 05:02
05:02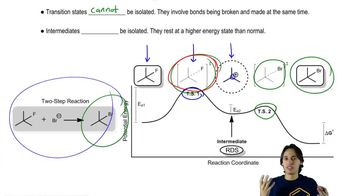 06:55
06:55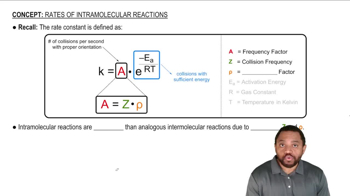 2:29
2:29What is each compound's systematic name?
b.
What is each compound's systematic name?
a.
Draw a reaction coordinate diagram for a two-step reaction in which the first step is endergonic, the second step is exergonic, and the overall reaction is endergonic. Label the reactants, products, intermediates, and transition states.
a. Which step in the reaction coordinate diagram shown here has the greatest free energy of activation in the forward direction?
b. Is the first-formed intermediate more apt to revert to reactants or go on to form products?
c. Which step is the rate-determining step of the reaction?
<IMAGE>
Which of the following parameters would be different for a reaction carried out in the presence of a catalyst compared with the same reaction carried out in the absence of a catalyst?
∆G°, ∆H‡, Ea, ∆S‡, ∆H°, Keq, ∆G‡, ∆S°, k
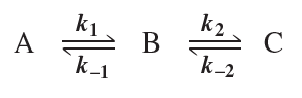
a. Which reaction has a greater equilibrium constant: one with a rate constant of 1 × 10⁻³ sec-1 for the forward reaction and a rate constant of 1 × 10⁻⁵ sec-1 for the reverse reaction, or one with a rate constant of 1 × 10⁻² sec-1 for the forward reaction and a rate constant of 1 × 10⁻³ sec-1 for the reverse reaction?
b. If both reactions start with a reactant concentration of 1.0 M, which reaction will form the most product when the reactions have reached equilibrium?