Skip to main content
Organic Chemistry
My Course
Learn
Exam Prep
AI Tutor
Study Guides
Textbook Solutions
Flashcards
Explore
Try the app
My Course
Learn
Exam Prep
AI Tutor
Study Guides
Textbook Solutions
Flashcards
Explore
Try the app
Back
The Beer-Lambert Law definitions
You can tap to flip the card.
Beer-Lambert Law
You can tap to flip the card.
👆
Beer-Lambert Law
A principle describing the linear relationship between solution concentration and light absorbance.
Track progress
Control buttons has been changed to "navigation" mode.
1/15
Related flashcards
Related practice
Recommended videos
The Beer-Lambert Law quiz
The Beer-Lambert Law
15 Terms
The Beer-Lambert Law
17. Ultraviolet Spectroscopy
5 problems
Topic
UV-Vis Spectroscopy of Conjugated Alkenes
17. Ultraviolet Spectroscopy
5 problems
Topic
17. Ultraviolet Spectroscopy
4 topics
12 problems
Chapter
2:36
The Beer-Lambert Law Concept 1
1
views
1:25
The Beer-Lambert Law Example 1
3
views
1:39
The Beer-Lambert Law Concept 2
2
views
Terms in this set (15)
Hide definitions
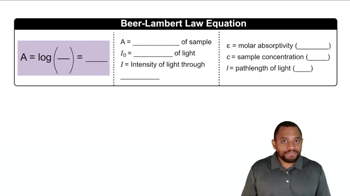
Beer-Lambert Law
A principle describing the linear relationship between solution concentration and light absorbance.
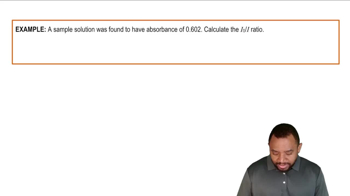
Absorbance
A measure of how much light a sample takes in, calculated using the ratio of initial to transmitted light intensity.
Concentration
The amount of solute present in a solution, typically expressed in molarity, affecting light absorption.
Molar Absorptivity
A constant indicating how strongly a substance absorbs light at a specific wavelength, with units L·mol⁻¹·cm⁻¹.
Path Length
The distance light travels through a sample, measured in centimeters, influencing absorbance.
Light Intensity
The amount of light energy entering or exiting a sample, denoted as I₀ before and I after the sample.
Lambda Max
The wavelength at which a sample exhibits peak absorbance on an absorbance versus wavelength graph.
Monochromator
A device that isolates a single wavelength of light before it passes through a sample.
Detector
An instrument that measures the intensity of light after it passes through a sample.
Molarity
A unit of concentration representing moles of solute per liter of solution.
Logarithm
A mathematical function used in the Beer-Lambert equation to relate light intensities to absorbance.
Linear Relationship
A direct proportionality between two variables, such as absorbance and concentration in this context.
Diluted Solution
A sample with low solute concentration, resulting in less light absorption and higher transmitted intensity.
Concentrated Solution
A sample with high solute concentration, leading to greater light absorption and lower transmitted intensity.
Absorbance Graph
A plot with absorbance on the y-axis and concentration on the x-axis, used to visualize their relationship.
 BackBack
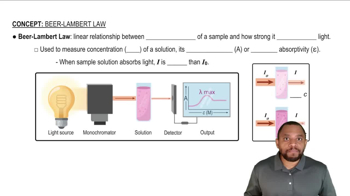
 2:36
2:36