PPF - Comparative Advantage and Trade: Videos & Practice Problems
Trading helps us reach levels of consumption that were previously unattainable. Team work makes the dream work!
If Joe and Carla plan to specialize and trade, what should Joe produce?
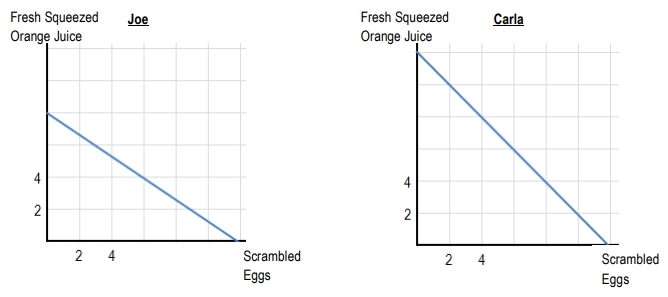

If Joe and Carla plan to specialize and trade, what should Carla produce?

Assume that Joe and Carla will trade Scrambled Eggs and Fresh Squeezed Orange Juice at a rate of 1.2 Eggs for 1 OJ. If Joe's consumption after trade includes six eggs, what will be Carla's consumption after trade?

Do you want more practice?
More setsGo over this topic definitions with flashcards
More setsHere's what students ask on this topic:
Comparative advantage is the ability of a person or country to produce a good at a lower opportunity cost than another. It determines specialization because each party should focus on producing the good for which they have the lowest opportunity cost. For example, if you give up fewer units of one good to produce another compared to your friend, you have a comparative advantage in that good. Specializing in the good with comparative advantage allows both parties to trade and consume beyond their individual production possibilities frontiers (PPFs), increasing overall efficiency and gains from trade.
Trade allows consumption beyond the PPF by enabling specialization based on comparative advantage. When two parties specialize in producing goods where they have lower opportunity costs and then trade, they can exchange goods at a mutually beneficial rate. This trade ratio lets each party consume combinations of goods that were previously unattainable alone. For instance, if you specialize in hunch punch and your friend in pizza rolls, trading at a set price like lets both enjoy more of both goods than their individual PPFs would allow.
Opportunity cost is calculated by determining how much of one good must be given up to produce an additional unit of another good. For example, if producing 1 pizza roll means giving up 2 gallons of hunch punch, the opportunity cost of 1 pizza roll is 2 gallons of hunch punch. Mathematically, if . The party with the lower opportunity cost for a good has the comparative advantage in producing that good.
The trading line represents the new consumption possibilities after specialization and trade. It extends beyond the original PPF, showing combinations of goods that can be consumed through trade. By plotting points where goods are exchanged at agreed prices, the trading line illustrates how both parties can reach consumption levels outside their individual production limits. This visualizes the gains from trade, confirming that specialization and exchange allow higher overall welfare than self-sufficiency.
The terms of trade specify the rate at which one good is exchanged for another, often expressed as a price ratio. It must lie between the opportunity costs of the two parties to be mutually beneficial. For example, if your opportunity cost of 1 pizza roll is 2 gallons of hunch punch and your friend's is 1 gallon, a trade price between 1 and 2 gallons per pizza roll benefits both. This ensures that each party gains more from trade than producing both goods themselves.
