Skip to main content
Microeconomics
My Course
Learn
Exam Prep
AI Tutor
Study Guides
Flashcards
Explore
Try the app
My Course
Learn
Exam Prep
AI Tutor
Study Guides
Flashcards
Explore
Try the app
Back
The Saving Function quiz
You can tap to flip the card.
What does the savings function relate?
You can tap to flip the card.
👆
What does the savings function relate?
The savings function relates household savings to the level of disposable income.
Track progress
Control buttons has been changed to "navigation" mode.
1/15
Related flashcards
Recommended videos
The Saving Function definitions
The Saving Function
15 Terms
Guided course
06:14
Saving Function (Saving Schedule)
1
views
Terms in this set (15)
Hide definitions
What does the savings function relate?
The savings function relates household savings to the level of disposable income.
What happens to savings and consumption when disposable income increases?
Both savings and consumption increase as disposable income rises.
What is the marginal propensity to save (MPS)?
The MPS is the change in savings divided by the change in disposable income.
How is the MPS represented on the savings function graph?
The MPS is the slope of the savings function.
Is the marginal propensity to save usually larger or smaller than the marginal propensity to consume?
The MPS is typically smaller than the marginal propensity to consume (MPC).
What does the 45-degree line on the savings function graph represent?
It represents the scenario where all disposable income is saved and none is consumed.
At a point where the savings function touches the 45-degree line, what is happening?
All disposable income is being saved at that point.
What does it mean if a point on the savings function is below the 45-degree line?
It means only part of the disposable income is being saved, and the rest is consumed.
Why is the savings function generally shallower than the consumption function?
Because households tend to consume most of their extra income and save only a small portion.
What is disposable income used for?
Disposable income is used for either consumption or savings.
What does the marginal propensity to consume (MPC) measure?
The MPC measures the change in consumption divided by the change in disposable income.
If you receive a bonus, what typically happens to your savings?
Your total savings are likely to increase, though you will also increase your consumption.
What does a point on the savings function above the 45-degree line imply?
It would imply saving more than your disposable income, which is not realistic.
How do you calculate the marginal propensity to save?
Divide the change in savings by the change in disposable income.
Why is the MPS important in understanding household behavior?
It shows how much of each additional dollar of income households are likely to save.
 BackBack
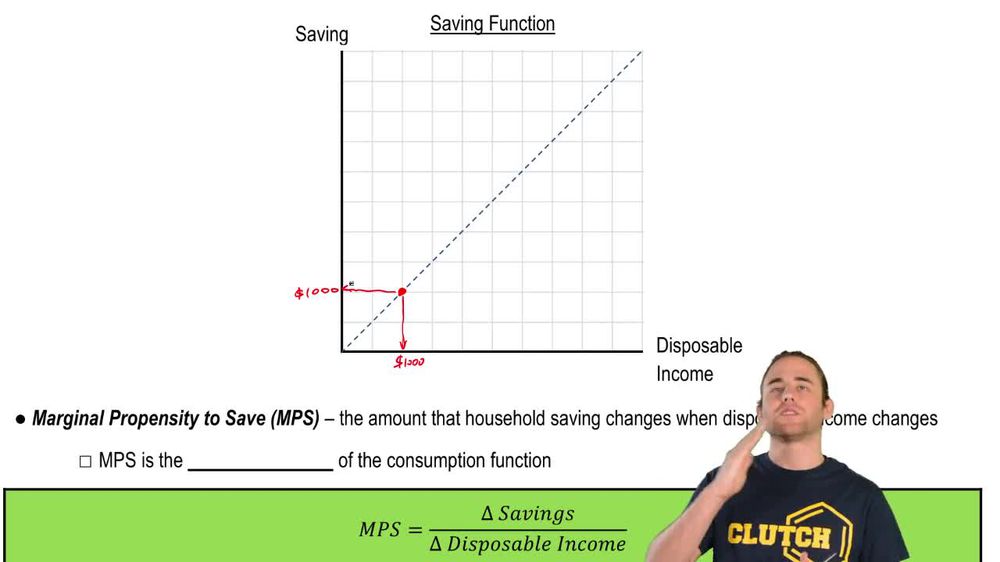
 06:14
06:14