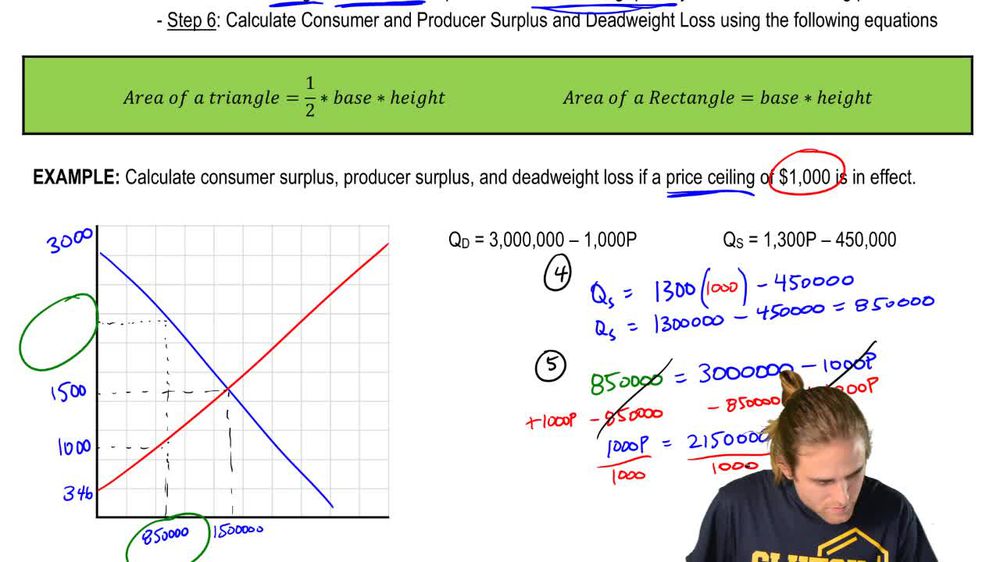
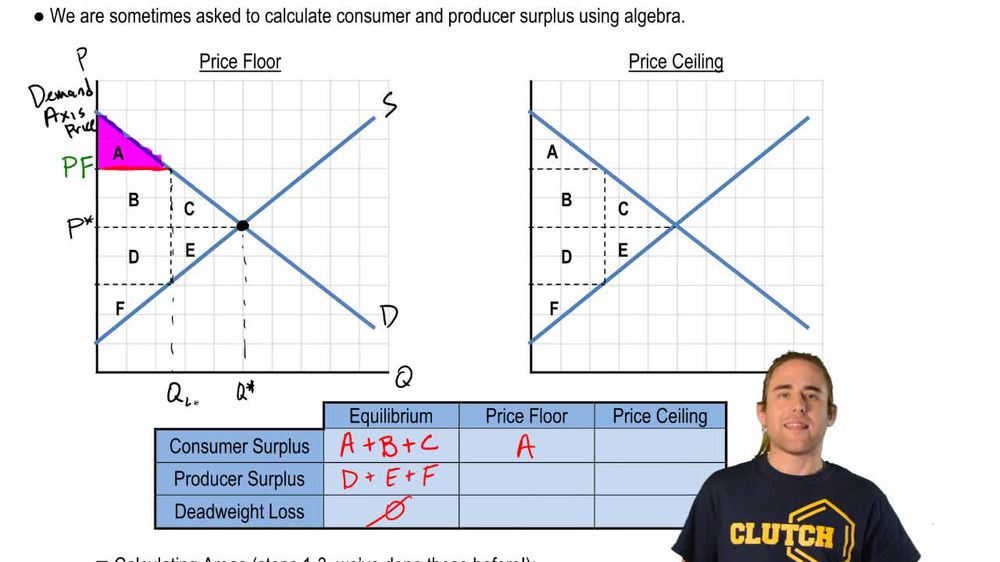
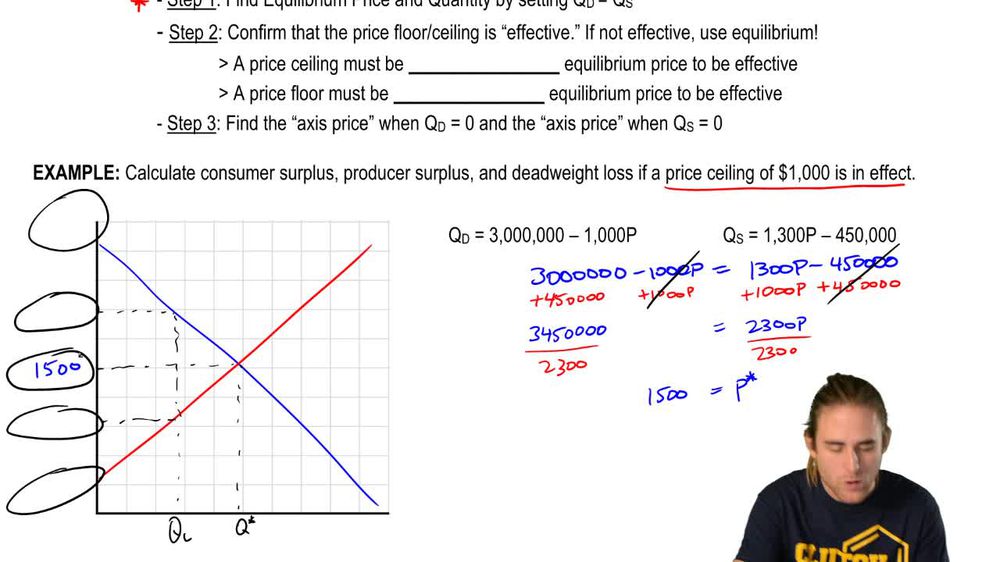
Back

Quantitative Analysis of Price Ceilings and Price Floors: Finding Areas definitions

Control buttons has been changed to "navigation" mode.
1/15
  • Consumer Surplus

    Represents the area above the price and below the demand curve, indicating the benefit buyers receive from paying less than their maximum willingness.
  • Producer Surplus

    Denotes the area below the price and above the supply curve, showing the benefit sellers gain from selling at prices higher than their minimum acceptable.
  • Deadweight Loss

    Measures the lost benefits to society from trades that do not occur due to market interventions, shown as missing areas on the graph.
  • Price Floor

    A minimum allowable price set above equilibrium, restricting trades and altering surplus distribution, often causing inefficiency.
  • Price Ceiling

    A maximum allowable price set below equilibrium, limiting market price and quantity, impacting surplus and efficiency.
  • Equilibrium Price

    The market-clearing price where demand and supply intersect, maximizing efficiency and eliminating deadweight loss.
  • Equilibrium Quantity

    The quantity traded at the intersection of demand and supply, representing the most efficient market outcome.
  • Demand Axis Price

    The price where the demand curve meets the price axis, used in surplus calculations and graphical analysis.
  • Supply Axis Price

    The price where the supply curve meets the price axis, essential for calculating producer surplus and deadweight loss.
  • Missing Price

    An additional price needed for area calculations, not directly given but crucial for splitting complex shapes on the graph.
  • Lower Quantity

    The reduced quantity traded under a price floor or ceiling, reflecting inefficiency and lost surplus.
  • Rectangle

    A geometric shape used to simplify area calculations for surplus, especially when splitting complex regions.
  • Triangle

    A geometric shape used in graphical analysis to break down surplus areas for easier computation.
  • Market Dynamics

    Describes the changes in surplus and efficiency resulting from price controls, illustrated through shifts in areas on the graph.
  • Graphical Analysis

    A method of visualizing and calculating surplus and deadweight loss by mapping areas on supply and demand graphs.