Skip to main content
Microeconomics
My Course
Learn
Exam Prep
AI Tutor
Study Guides
Flashcards
Explore
Try the app
My Course
Learn
Exam Prep
AI Tutor
Study Guides
Flashcards
Explore
Try the app
Back
Price Elasticity of Supply on a Graph definitions
You can tap to flip the card.
Supply Curve
You can tap to flip the card.
👆
Supply Curve
Graphical representation showing the relationship between price and quantity supplied, typically sloping upward.
Track progress
Control buttons has been changed to "navigation" mode.
1/14
Related flashcards
Related practice
Recommended videos
Price Elasticity of Supply on a Graph quiz
Price Elasticity of Supply on a Graph
15 Terms
Price Elasticity of Supply on a Graph
4. Elasticity
10 problems
Topic
Elasticity Summary
4. Elasticity
10 problems
Topic
4. Elasticity
11 topics
15 problems
Chapter
Guided course
03:46
Price Elasticity of Supply on a Graph
10
views
Terms in this set (14)
Hide definitions
Supply Curve
Graphical representation showing the relationship between price and quantity supplied, typically sloping upward.
Elasticity
Measure of responsiveness in quantity supplied to changes in price, indicating how flexible producers are.
Perfectly Elastic Supply
Situation where any change in price leads to infinite change in quantity supplied, depicted as a horizontal line.
Perfectly Inelastic Supply
Condition where quantity supplied remains unchanged regardless of price, shown as a vertical line.
Unit Elastic Supply
Supply curve passing through the origin, indicating proportional change in quantity supplied to price.
Elastic Supply
Supply curve cutting through the price axis, reflecting high sensitivity of quantity supplied to price changes.
Inelastic Supply
Supply curve cutting through the quantity axis, showing low responsiveness of quantity supplied to price.
Price Axis
Vertical axis on a supply graph representing the price of a good or service.
Quantity Axis
Horizontal axis on a supply graph representing the amount of a good or service supplied.
Origin
Point where the price and quantity axes intersect, used to identify unit elastic supply curves.
Slope
Degree of steepness of the supply curve, indicating the elasticity level.
Rotation
Change in the supply curve’s direction on the graph, differing from demand due to upward slope.
Horizontal Line
Graphical feature representing perfectly elastic supply, where price remains constant as quantity changes.
Vertical Line
Graphical feature representing perfectly inelastic supply, where quantity remains constant as price changes.
 BackBack
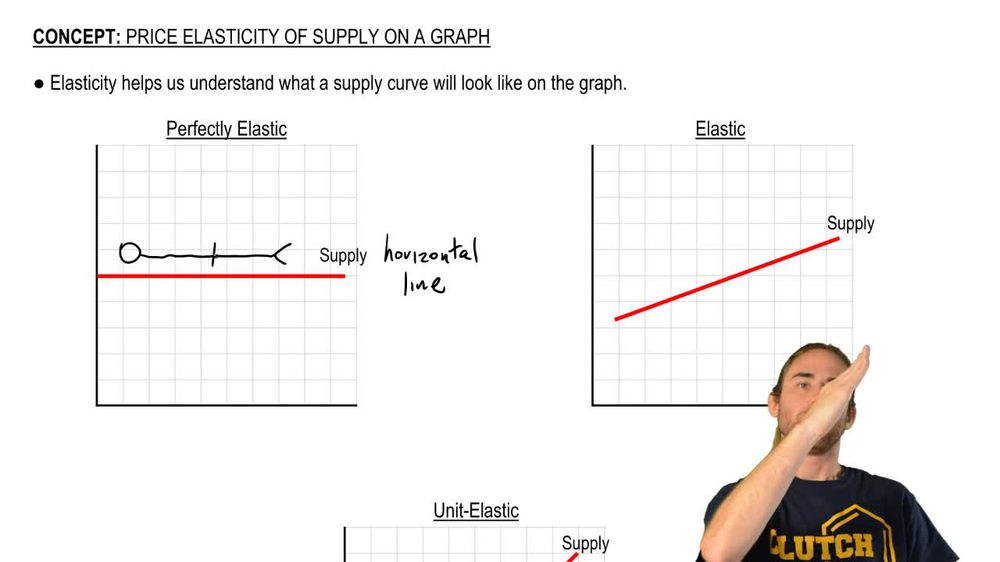
 03:46
03:46