What is the AD-AS model used to determine in the economy?
The AD-AS model is used to determine the equilibrium price level and real GDP in the economy.
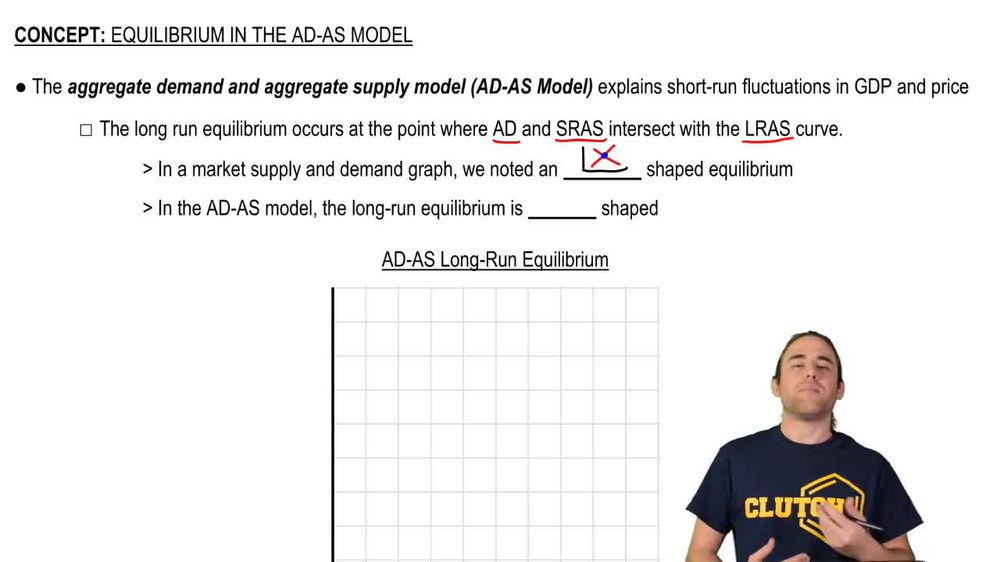
Where does long-run equilibrium occur in the AD-AS model?
Long-run equilibrium occurs where aggregate demand, short-run aggregate supply, and long-run aggregate supply all intersect.
What are the axes labeled on the AD-AS model graph?
The y-axis is labeled as price level, and the x-axis is labeled as real GDP.
How is the aggregate demand curve typically shaped in the AD-AS model?
The aggregate demand curve is downward sloping in the AD-AS model.
What is the shape of the short-run aggregate supply curve in the AD-AS model?
The short-run aggregate supply curve is upward sloping.
How is the long-run aggregate supply curve typically drawn in the AD-AS model?
The long-run aggregate supply curve is drawn as a vertical line.
What happens to equilibrium when aggregate demand shifts in the short run?
When aggregate demand shifts in the short run, the short-run equilibrium changes, resulting in a new intersection with the short-run aggregate supply curve.
Is short-run equilibrium always the same as long-run equilibrium?
No, short-run equilibrium is not necessarily the same as long-run equilibrium; it can differ if AD or SRAS shifts.
What determines the short-run equilibrium in the AD-AS model?
Short-run equilibrium is determined by the intersection of aggregate demand and short-run aggregate supply.
What can cause the AD or SRAS curves to shift in the AD-AS model?
Changes in economic factors such as consumer confidence, input prices, or government policy can cause AD or SRAS to shift.
What is the significance of the intersection point of all three curves in the AD-AS model?
The intersection point of AD, SRAS, and LRAS represents the long-run equilibrium price level and real GDP.
How does the AD-AS model illustrate economic fluctuations?
The AD-AS model shows how shifts in AD or SRAS can lead to changes in price level and real GDP, illustrating economic fluctuations.
What is meant by the market-clearing price in the AD-AS model?
The market-clearing price is the equilibrium price level where aggregate demand equals aggregate supply.
Why is it helpful to use different colors when drawing shifted curves in the AD-AS model?
Using different colors helps distinguish between original and shifted curves, making it easier to analyze changes in equilibrium.
What does a shift in aggregate demand or supply indicate in the context of the AD-AS model?
A shift in aggregate demand or supply indicates a change in economic conditions, leading to a new equilibrium in the short run or long run.
 Back
Back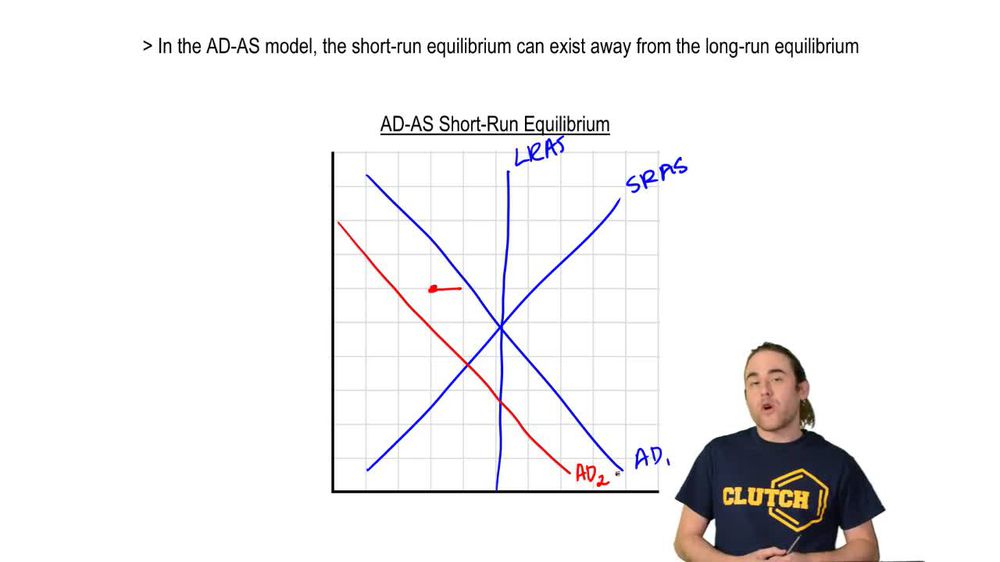
 02:35
02:35