Skip to main content
Macroeconomics
My Course
Learn
Exam Prep
AI Tutor
Study Guides
Flashcards
Explore
Try the app
My Course
Learn
Exam Prep
AI Tutor
Study Guides
Flashcards
Explore
Try the app
Back
Total Revenue Along a Linear Demand Curve definitions
You can tap to flip the card.
Elasticity
You can tap to flip the card.
👆
Elasticity
A measure comparing percentage changes in two variables, revealing how responsive one is to changes in the other.
Track progress
Control buttons has been changed to "navigation" mode.
1/13
Related flashcards
Related practice
Recommended videos
Total Revenue Along a Linear Demand Curve quiz
Total Revenue Along a Linear Demand Curve
15 Terms
Total Revenue Along a Linear Demand Curve
4. Elasticity
10 problems
Topic
Income Elasticity of Demand
4. Elasticity
9 problems
Topic
4. Elasticity - Part 1 of 2
10 topics
15 problems
Chapter
4. Elasticity - Part 2 of 2
1 topic
3 problems
Chapter
Guided course
07:13
Total Revenue Along a Linear Demand Curve
9
views
Terms in this set (13)
Hide definitions
Elasticity
A measure comparing percentage changes in two variables, revealing how responsive one is to changes in the other.
Slope
A ratio showing the unit change between two variables, remaining constant along a straight line.
Linear Demand Curve
A straight line graph connecting price and quantity, with constant unit changes but varying percentage changes.
Unit Elastic Point
The midpoint on a demand curve where total revenue reaches its highest value.
Elastic Section
The part of a demand curve where percentage change in quantity demanded exceeds that of price.
Inelastic Section
The region of a demand curve where percentage change in price is greater than that of quantity demanded.
Total Revenue
The result of multiplying price by quantity sold, indicating overall earnings from sales.
Midpoint
The central location on a linear demand curve dividing elastic and inelastic regions.
Percentage Change
A calculation expressing how much a variable increases or decreases relative to its original value.
Quantity Demanded
The amount of a good consumers are willing to buy at a specific price.
Price Axis
The vertical line on a graph representing different possible prices for a good.
Quantity Axis
The horizontal line on a graph showing various amounts of a good.
Revenue Maximization
The point where earnings from sales are at their highest, typically at the unit elastic point.
 BackBack
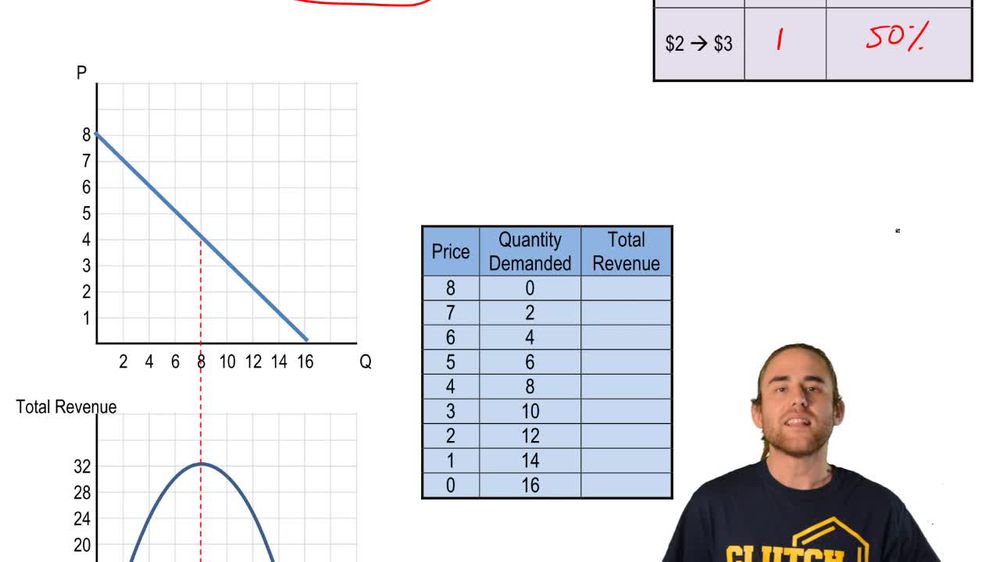
 07:13
07:13