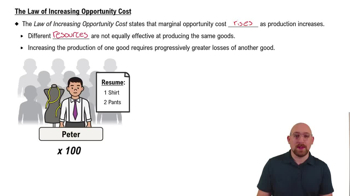
What does the law of increasing opportunity cost state?
It states that marginal opportunity cost rises as production of a good increases, meaning producing more of one good results in greater losses of the other good.
Why do different resources lead to increasing marginal opportunity costs?
Because resources are not equally effective at producing all goods, reallocating them leads to higher opportunity costs as less efficient resources are used.
In the Genius Co example, why were Shirleys assigned to the shirt factory?
Shirleys are more efficient at making shirts, so assigning them there maximizes shirt production.
What happens to pants production when more Shirleys are moved to make shirts?
Pants production decreases because Shirleys are moved away from making pants to make more shirts.
How does the opportunity cost change as more shirts are produced in the Genius Co example?
The opportunity cost increases; initially, fewer pants are lost per additional shirt, but later, many more pants are lost for the same increase in shirts.
What is allocative efficiency?
Allocative efficiency is the mix of production where marginal benefit equals marginal cost, reflecting consumer preferences.
How is the marginal benefit of a good determined in this context?
Marginal benefit must be provided externally and cannot be derived from the PPF; it reflects consumers' willingness to pay for additional units.
Why does the marginal benefit curve slope downward as more pizzas are produced?
Because each additional pizza provides less value to consumers, reflecting diminishing marginal benefit.
How is the marginal cost curve plotted on the graph?
It is plotted using the arc method, taking the average (midpoint) between units to reflect increasing costs.
At what point is allocative efficiency achieved on the graph?
Allocative efficiency is achieved where the marginal benefit curve intersects the marginal cost curve.
What is the efficient quantity of soy cheese pizzas and craft beers in the example?
The efficient quantity is 2.5 million pizzas and 10 craft beers.
Why can't the PPF alone tell us the marginal benefit of a good?
Because the PPF only shows possible production combinations, not consumer preferences or willingness to pay.
What does a bowed-outward PPF curve indicate?
It indicates increasing marginal opportunity costs as more of one good is produced.
What does it mean for a point to be both productively and allocatively efficient?
It means the point is on the PPF (using resources efficiently) and at the mix where marginal benefit equals marginal cost.
How do you find the efficient quantity of the second good when given the efficient quantity of the first?
You refer back to the PPF graph to see how much of the second good can be produced when the first good is at its efficient quantity.
 Back
Back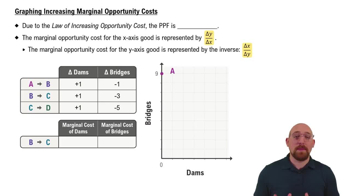
 03:33
03:33