Skip to main content
Macroeconomics
My Course
Learn
Exam Prep
AI Tutor
Study Guides
Flashcards
Explore
Try the app
My Course
Learn
Exam Prep
AI Tutor
Study Guides
Flashcards
Explore
Try the app
Back
Monopoly Profit on the Graph quiz
You can tap to flip the card.
Where does a monopoly find its profit-maximizing quantity on a graph?
You can tap to flip the card.
👆
Where does a monopoly find its profit-maximizing quantity on a graph?
A monopoly finds its profit-maximizing quantity where the marginal revenue (MR) curve intersects the marginal cost (MC) curve.
Track progress
Control buttons has been changed to "navigation" mode.
1/15
Related flashcards
Recommended videos
Monopoly Profit on the Graph definitions
Monopoly Profit on the Graph
14 Terms
Guided course
07:41
Monopoly Profit on the Graph
Terms in this set (15)
Hide definitions
Where does a monopoly find its profit-maximizing quantity on a graph?
A monopoly finds its profit-maximizing quantity where the marginal revenue (MR) curve intersects the marginal cost (MC) curve.
What formula is used to calculate profit or loss for a monopoly?
Profit or loss is calculated as (Price - Average Total Cost) × Quantity.
How does a monopoly determine the price to charge for its profit-maximizing quantity?
The monopoly finds the price by going up from the profit-maximizing quantity to the demand curve.
Why is marginal revenue not equal to price in a monopoly?
In a monopoly, marginal revenue is less than price because the firm must lower the price to sell additional units, affecting all units sold.
From which curve does a monopoly get the average total cost for profit calculation?
The average total cost is found by going up from the profit-maximizing quantity to the average total cost (ATC) curve.
What does the area between the price and average total cost at the profit-maximizing quantity represent?
This area represents the monopoly's profit if price is above ATC, or loss if price is below ATC.
What is the first step in finding monopoly profit or loss on a graph?
The first step is to find the quantity where marginal revenue equals marginal cost.
How does the process of finding profit in monopoly differ from perfect competition?
In monopoly, marginal revenue and price are different, so you must use the demand curve for price, unlike perfect competition where MR equals price.
What does it mean if the average total cost is greater than the price at the profit-maximizing quantity?
It means the monopoly is operating at a loss.
What does the demand curve represent for a monopoly?
The demand curve represents the price the monopoly can charge for each quantity sold.
Why is it important to distinguish between the marginal revenue and demand curves in monopoly analysis?
Because marginal revenue determines the profit-maximizing quantity, while the demand curve determines the price at that quantity.
What is the significance of the intersection point of the MR and MC curves?
It determines the quantity at which the monopoly maximizes profit or minimizes loss.
If a monopoly's ATC curve is below the demand curve at the profit-maximizing quantity, what does this indicate?
It indicates the monopoly is earning a profit.
What is the role of the average total cost curve in monopoly profit analysis?
It shows the cost per unit at full production, which is used to calculate profit or loss.
How do you identify a loss on a monopoly graph?
A loss is identified when the average total cost at the profit-maximizing quantity is above the price from the demand curve.
 BackBack
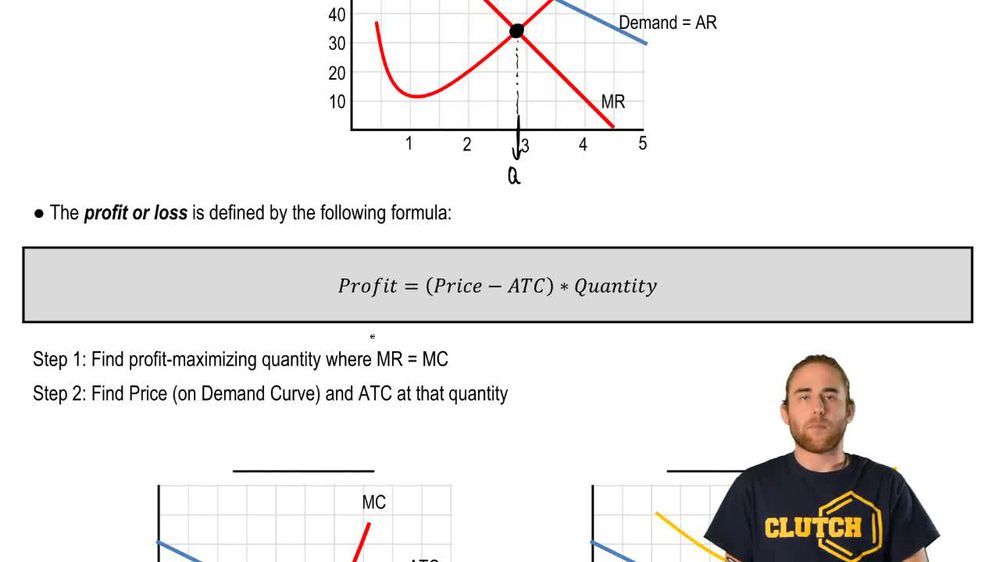
 07:41
07:41