Skip to main content
Macroeconomics
My Course
Learn
Exam Prep
AI Tutor
Study Guides
Flashcards
Explore
Try the app
My Course
Learn
Exam Prep
AI Tutor
Study Guides
Flashcards
Explore
Try the app
Back
Monopoly Profit on the Graph definitions
You can tap to flip the card.
Monopoly
You can tap to flip the card.
👆
Monopoly
A market structure with a single seller, allowing control over price and output, distinct from perfect competition.
Track progress
Control buttons has been changed to "navigation" mode.
1/14
Related flashcards
Recommended videos
Monopoly Profit on the Graph quiz
Monopoly Profit on the Graph
15 Terms
Guided course
07:41
Monopoly Profit on the Graph
Terms in this set (14)
Hide definitions
Monopoly
A market structure with a single seller, allowing control over price and output, distinct from perfect competition.
Profit Maximizing Quantity
The output level where marginal revenue equals marginal cost, ensuring the highest possible profit or smallest loss.
Marginal Revenue
The additional income from selling one more unit, which differs from price in non-competitive markets.
Marginal Cost
The extra expense incurred from producing one additional unit, crucial for determining optimal output.
Demand Curve
A graphical representation showing the relationship between price and quantity demanded, also indicating price in monopoly.
Average Total Cost
The total cost per unit at a given output, found on the corresponding curve and used to calculate profit or loss.
Loss Minimizing Quantity
The output level where losses are smallest, found where marginal revenue equals marginal cost, even if profit is negative.
Price
The amount consumers pay for a good, determined from the demand curve at the profit maximizing quantity.
Profit
The area between price and average total cost, multiplied by quantity, representing financial gain on the graph.
Loss
The area where average total cost exceeds price, multiplied by quantity, indicating negative financial outcome.
Perfect Competition
A market structure with many sellers, where marginal revenue equals price and the demand curve is flat.
Market Structure
The organizational characteristics of a market, influencing pricing, output, and efficiency.
Average Revenue
The revenue per unit sold, which equals price in monopoly and is represented by the demand curve.
Cost Curve
A graphical tool showing how costs like marginal or average total cost change with output.
 BackBack
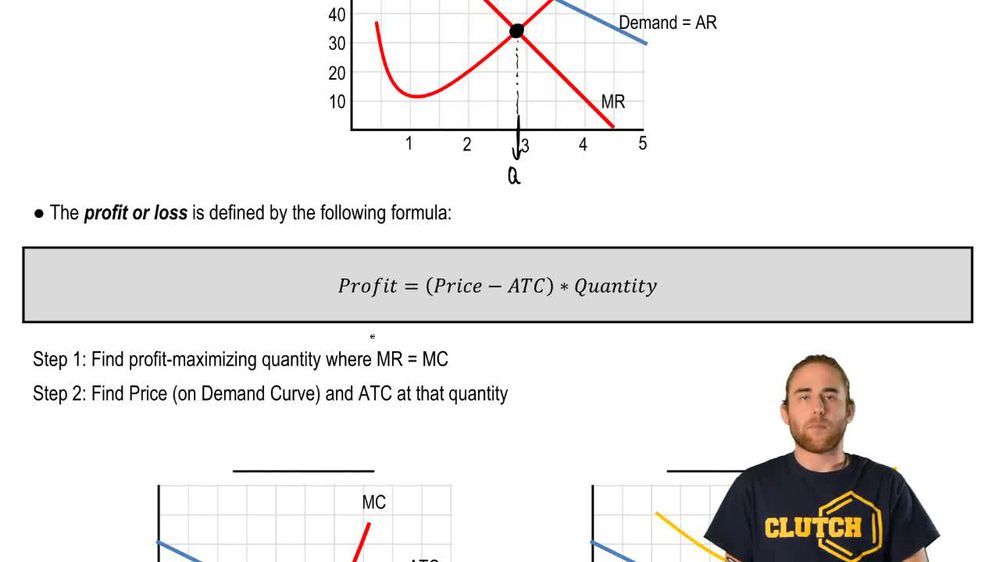
 07:41
07:41