Skip to main content
Macroeconomics
My Course
Learn
Exam Prep
AI Tutor
Study Guides
Flashcards
Explore
Try the app
My Course
Learn
Exam Prep
AI Tutor
Study Guides
Flashcards
Explore
Try the app
Back
Individual Supply and Market Supply quiz
You can tap to flip the card.
How is the market supply curve derived from individual supply curves?
You can tap to flip the card.
👆
How is the market supply curve derived from individual supply curves?
The market supply curve is derived by summing the individual supply curves of all suppliers in the market at each price level.
Track progress
Control buttons has been changed to "navigation" mode.
1/15
Related flashcards
Related practice
Recommended videos
Individual Supply and Market Supply definitions
Individual Supply and Market Supply
14 Terms
Individual Supply and Market Supply
3. Supply and Demand
10 problems
Topic
Shifting Supply
3. Supply and Demand
10 problems
Topic
3. Supply and Demand - Part 1 of 2
11 topics
15 problems
Chapter
3. Supply and Demand - Part 2 of 2
1 topic
3 problems
Chapter
Guided course
06:04
Individual Supply and Market Supply
6
views
Terms in this set (15)
Hide definitions
How is the market supply curve derived from individual supply curves?
The market supply curve is derived by summing the individual supply curves of all suppliers in the market at each price level.
What does the law of supply state about the relationship between price and quantity supplied?
The law of supply states that as the price increases, the quantity supplied also increases.
At a price of \$2, how many supreme pizzas does Papa Yams supply?
At a price of \$2, Papa Yams supplies 2 supreme pizzas.
At a price of \$2, how many supreme pizzas does Domino supply?
At a price of \$2, Domino supplies 0 supreme pizzas.
What is the total market supply of supreme pizzas at a price of \$2?
The total market supply at a price of \$2 is 2 supreme pizzas.
How many supreme pizzas does the market supply at a price of \$10?
At a price of \$10, the market supplies 18 supreme pizzas.
How do you calculate the market supply at a given price?
You calculate the market supply by adding the quantities supplied by all individual suppliers at that price.
What is the quantity supplied by Papa Yams at a price of \$6?
At a price of \$6, Papa Yams supplies 8 pizzas.
What is the quantity supplied by Domino at a price of \$6?
At a price of \$6, Domino supplies 2 pizzas.
What is the total market supply at a price of \$6?
The total market supply at a price of \$6 is 10 pizzas.
How does graphical representation help in understanding supply curves?
Graphical representation helps visualize how individual supplies at different prices contribute to the total market supply.
What are the axes labels when graphing a supply curve?
The price is on the Y-axis and the quantity is on the X-axis.
At a price of \$8, how many pizzas does Domino supply?
At a price of \$8, Domino supplies 3 pizzas.
At a price of \$8, what is the total market supply of pizzas?
At a price of \$8, the total market supply is 14 pizzas.
What is the final market supply curve a graphical summation of?
The final market supply curve is a graphical summation of all individual supply curves plotted against different price levels.
 BackBack
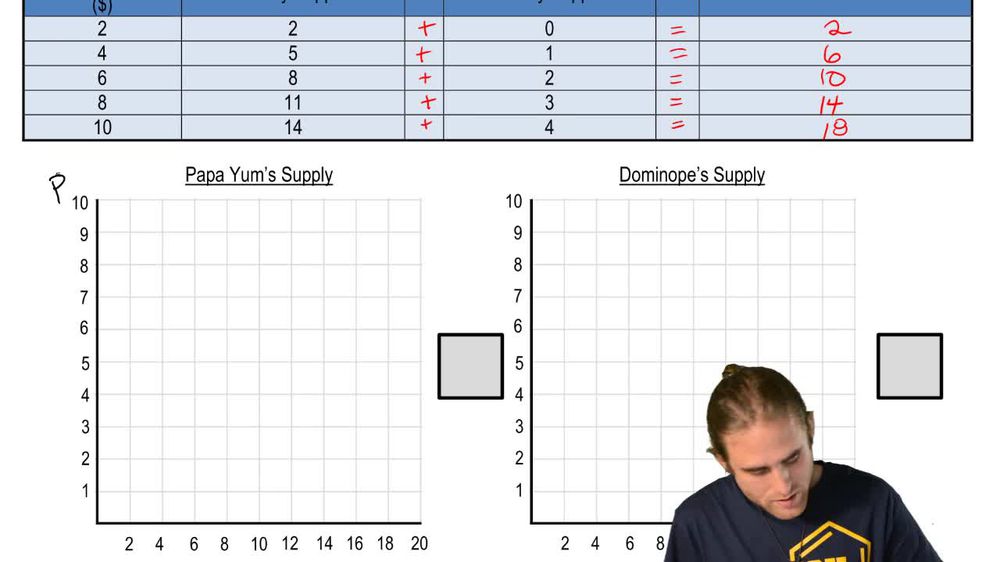
 06:04
06:04