Skip to main content
Macroeconomics
My Course
Learn
Exam Prep
AI Tutor
Study Guides
Flashcards
Explore
Try the app
My Course
Learn
Exam Prep
AI Tutor
Study Guides
Flashcards
Explore
Try the app
Back
Individual Supply and Market Supply definitions
You can tap to flip the card.
Market Supply Curve
You can tap to flip the card.
👆
Market Supply Curve
Graphical representation showing total quantity offered by all suppliers at various prices in a market.
Track progress
Control buttons has been changed to "navigation" mode.
1/14
Related flashcards
Related practice
Recommended videos
Individual Supply and Market Supply quiz
Individual Supply and Market Supply
15 Terms
Individual Supply and Market Supply
3. Supply and Demand
10 problems
Topic
Shifting Supply
3. Supply and Demand
10 problems
Topic
3. Supply and Demand - Part 1 of 2
11 topics
15 problems
Chapter
3. Supply and Demand - Part 2 of 2
1 topic
3 problems
Chapter
Guided course
06:04
Individual Supply and Market Supply
6
views
Terms in this set (14)
Hide definitions
Market Supply Curve
Graphical representation showing total quantity offered by all suppliers at various prices in a market.
Individual Supply Curve
Graph plotting the quantity a single supplier is willing to offer at different price points.
Quantity Supplied
Amount of a good that suppliers are prepared to offer for sale at a specific price.
Law of Supply
Principle stating that higher prices lead to greater quantities offered by suppliers.
Price Axis
Vertical line on a graph indicating the range of possible prices for a good.
Quantity Axis
Horizontal line on a graph showing the range of quantities supplied.
Graphical Representation
Visual display, often a line or curve, illustrating relationships between price and quantity.
Summation
Process of adding individual quantities from all suppliers to determine total market supply.
Supplier
Entity or business offering goods for sale in response to market prices.
Price Level
Specific value on the price axis used to determine corresponding quantities supplied.
Market
Environment where buyers and sellers interact to exchange goods and services.
Supreme Pizza
Example product used to illustrate how quantities supplied change with price.
Papa Yums
Hypothetical supplier used to demonstrate individual supply responses in the market.
Domino
Another hypothetical supplier used to show variation in supply at different prices.
 BackBack
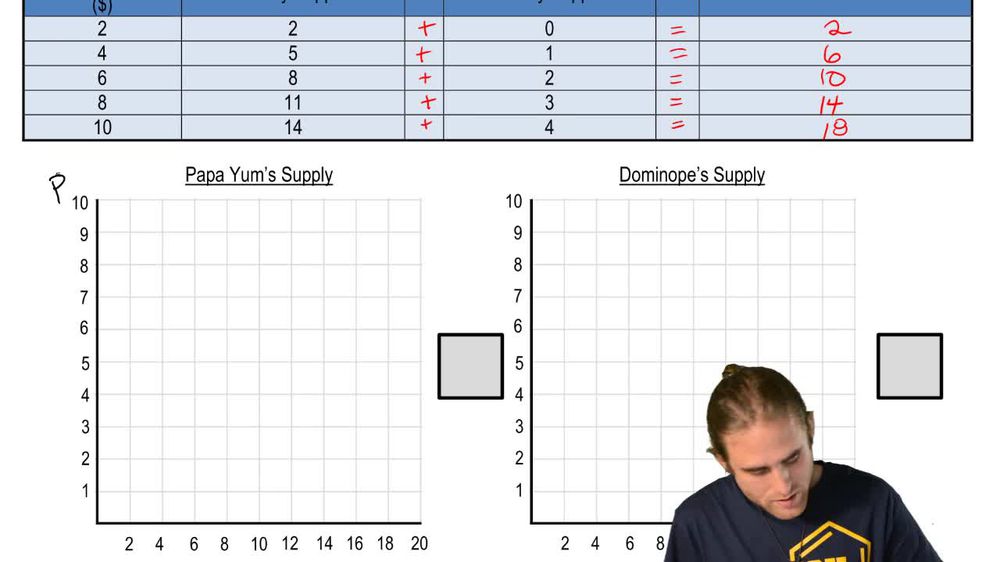
 06:04
06:04