Skip to main content
Macroeconomics
My Course
Learn
Exam Prep
AI Tutor
Study Guides
Flashcards
Explore
Try the app
My Course
Learn
Exam Prep
AI Tutor
Study Guides
Flashcards
Explore
Try the app
Back
Effects of Taxes on a Market definitions
You can tap to flip the card.
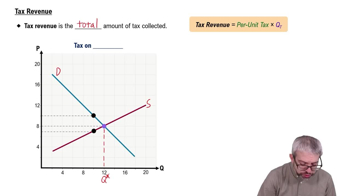
Tax Revenue
You can tap to flip the card.
👆
Tax Revenue
Total amount collected by multiplying the per unit tax by the quantity exchanged after the tax is imposed.
Track progress
Control buttons has been changed to "navigation" mode.
1/15
Related flashcards
Related practice
Recommended videos
Effects of Taxes on a Market quiz
Effects of Taxes on a Market
15 Terms
Effects of Taxes on a Market
6. Introduction to Taxes
10 problems
Topic
Elasticity and Taxes
6. Introduction to Taxes
10 problems
Topic
6. Introduction to Taxes
6 topics
14 problems
Chapter
Guided course
09:45
Effects of Taxes
10
views
03:59
Tax Revenue
Terms in this set (15)
Hide definitions
Tax Revenue
Total amount collected by multiplying the per unit tax by the quantity exchanged after the tax is imposed.
Per Unit Tax
Fixed amount charged on each unit sold, calculated as the difference between buyer and seller prices.
Equilibrium Quantity
Market amount exchanged where supply and demand curves intersect without any tax.
Supply Curve
Upward sloping line showing the relationship between price and quantity sellers are willing to offer.
Demand Curve
Downward sloping line showing the relationship between price and quantity buyers are willing to purchase.
Consumer Surplus
Area above the price and below the demand curve, representing buyers' net benefit.
Producer Surplus
Area below the price and above the supply curve, representing sellers' net benefit.
Deadweight Loss
Lost economic surplus from trades that no longer occur due to the tax, shown as missing areas on the graph.
Economic Surplus
Sum of consumer surplus, producer surplus, and tax revenue, representing total market benefit.
Rectangle
Graphical area representing tax revenue, formed by the per unit tax and the quantity exchanged.
Equilibrium Price
Market price where supply equals demand, before any tax is imposed.
Price Discrepancy
Difference between what buyers pay and sellers receive after a tax is imposed.
Quantity After Taxes
Amount exchanged in the market after the tax shifts supply or demand, typically less than equilibrium quantity.
Tax on Sellers
Situation where the supply curve shifts left, causing sellers to receive less than buyers pay.
Total Surplus
Combined value of consumer surplus, producer surplus, and tax revenue, maximized at equilibrium.
 BackBack
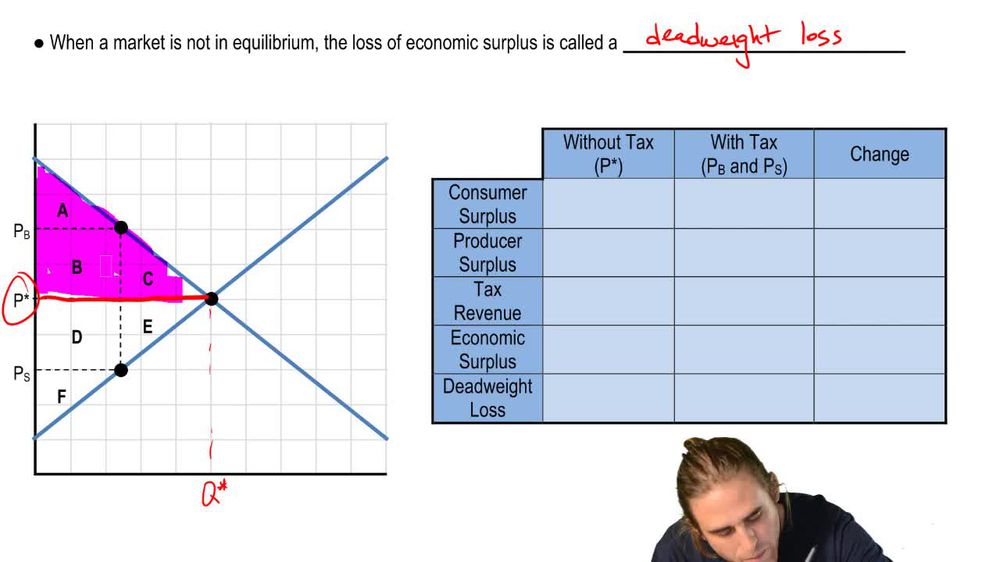
 09:45
09:45