Skip to main content
Macroeconomics
My Course
Learn
Exam Prep
AI Tutor
Study Guides
Flashcards
Explore
Try the app
My Course
Learn
Exam Prep
AI Tutor
Study Guides
Flashcards
Explore
Try the app
Back
Consumer Optimum Consumption: Budget Constraint and Indifference Curves definitions
You can tap to flip the card.
Budget Constraint
You can tap to flip the card.
👆
Budget Constraint
A line representing all combinations of goods a consumer can afford given income and prices, forming the boundary of possible choices.
Track progress
Control buttons has been changed to "navigation" mode.
1/15
Related flashcards
Recommended videos
Consumer Optimum Consumption: Budget Constraint and Indifference Curves quiz
Consumer Optimum Consumption: Budget Constraint and Indifference Curves
15 Terms
Guided course
07:07
Consumer Optimum Consumption: Budget Constraint and Indifference Curves
Terms in this set (15)
Hide definitions
Budget Constraint
A line representing all combinations of goods a consumer can afford given income and prices, forming the boundary of possible choices.
Indifference Curve
A curve showing combinations of goods that provide equal satisfaction, with higher curves indicating greater utility.
Utility
A measure of satisfaction or happiness a consumer derives from consuming goods and services.
Optimum Consumption
The point where satisfaction is maximized within income limits, found where the budget line just touches the highest attainable indifference curve.
Tangency Condition
A situation where the budget line and an indifference curve touch at only one point, indicating maximum attainable utility.
Income
The total amount of money available to a consumer for spending on goods and services.
Price
The amount of money required to purchase a unit of a good, influencing the slope and position of the budget constraint.
Satisfaction
The subjective benefit or pleasure a consumer receives from consuming a particular bundle of goods.
Equilibrium
A state where a consumer's chosen bundle of goods cannot increase utility given their budget, typically at the tangency point.
Consumption Possibilities
All combinations of goods a consumer can purchase given their income and the prices of goods.
Utility Curve
A graphical representation of satisfaction levels, with each curve corresponding to a specific amount of utility.
Aggregate Demand
The total demand for goods and services in an economy, influenced by individual consumption choices.
Marginal Utility
The additional satisfaction gained from consuming one more unit of a good, shaping the slope of indifference curves.
Parallel Shift
A movement of the budget constraint outward or inward, reflecting changes in income while prices remain constant.
Axis
A reference line on a graph representing the quantity of a good, used to plot budget constraints and indifference curves.
 BackBack
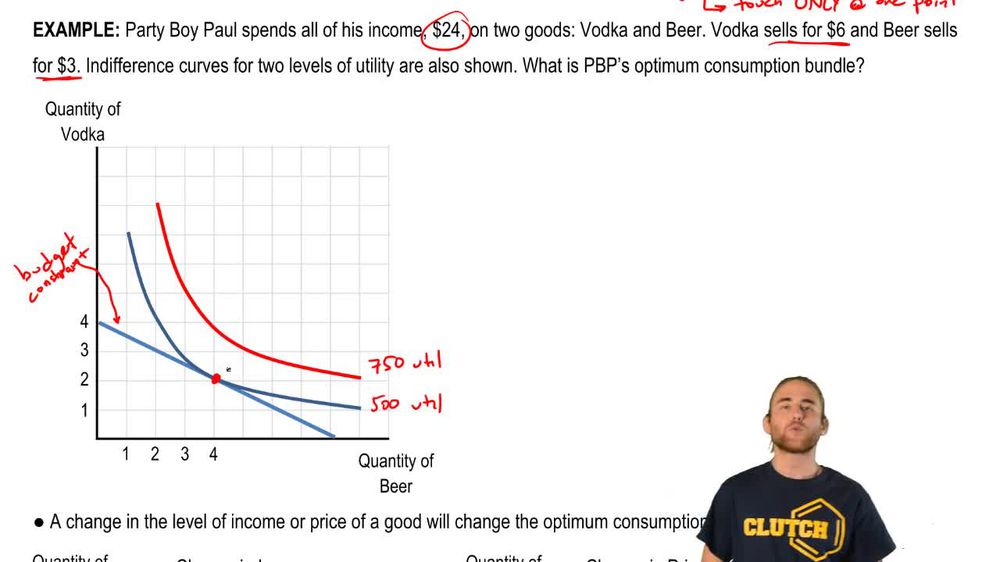
 07:07
07:07