Skip to main content
Macroeconomics
My Course
Learn
Exam Prep
AI Tutor
Study Guides
Flashcards
Explore
Try the app
My Course
Learn
Exam Prep
AI Tutor
Study Guides
Flashcards
Explore
Try the app
Back
Overview of Supply and Demand Shifts definitions
You can tap to flip the card.
Supply Curve
You can tap to flip the card.
👆
Supply Curve
A graphical representation showing the relationship between price and quantity offered by producers at various price levels.
Track progress
Control buttons has been changed to "navigation" mode.
1/15
Related flashcards
Related practice
Recommended videos
Overview of Supply and Demand Shifts quiz
Overview of Supply and Demand Shifts
15 Terms
Big Daddy Shift Summary
3. Supply and Demand
10 problems
Topic
Supply and Demand Together: Equilibrium, Shortage, and Surplus
3. Supply and Demand
10 problems
Topic
3. Supply and Demand - Part 1 of 2
11 topics
15 problems
Chapter
3. Supply and Demand - Part 2 of 2
1 topic
3 problems
Chapter
Guided course
04:05
Overview of Supply and Demand Shifts
5
views
Terms in this set (15)
Hide definitions
Supply Curve
A graphical representation showing the relationship between price and quantity offered by producers at various price levels.
Demand Curve
A visual tool illustrating how much consumers are willing to purchase at different price points.
Nature
Environmental or natural events that can directly alter the amount of goods producers can offer.
Expectations
Producer beliefs about future prices that can influence hiring, storage, or current output decisions.
Subsidies
Financial support from the government that lowers production costs and encourages increased output.
Technology
Advancements or improvements in production methods that typically boost the quantity supplied.
Number of Suppliers
The total count of producers in a market, which affects the overall market supply.
Substitute in Production
An alternative good that can be produced with the same resources, affecting supply when its price changes.
Input Prices
Costs of resources like labor and materials required for production, impacting the amount producers can supply.
Taxes
Government-imposed charges that increase production costs and can reduce the quantity supplied.
Storage
Holding back current production based on expectations, which temporarily reduces market supply.
Movement Along the Curve
A change in quantity supplied or demanded resulting solely from a price change, not from a shift in the curve.
Shift Summary Page
A consolidated reference listing all factors that cause supply and demand curves to shift, aiding exam preparation.
Directly Proportional Factors
Elements that cause supply to increase when they rise, as captured by the NESTS mnemonic.
Inversely Proportional Factors
Elements that cause supply to decrease when they rise, as summarized by the SITE mnemonic.
 BackBack
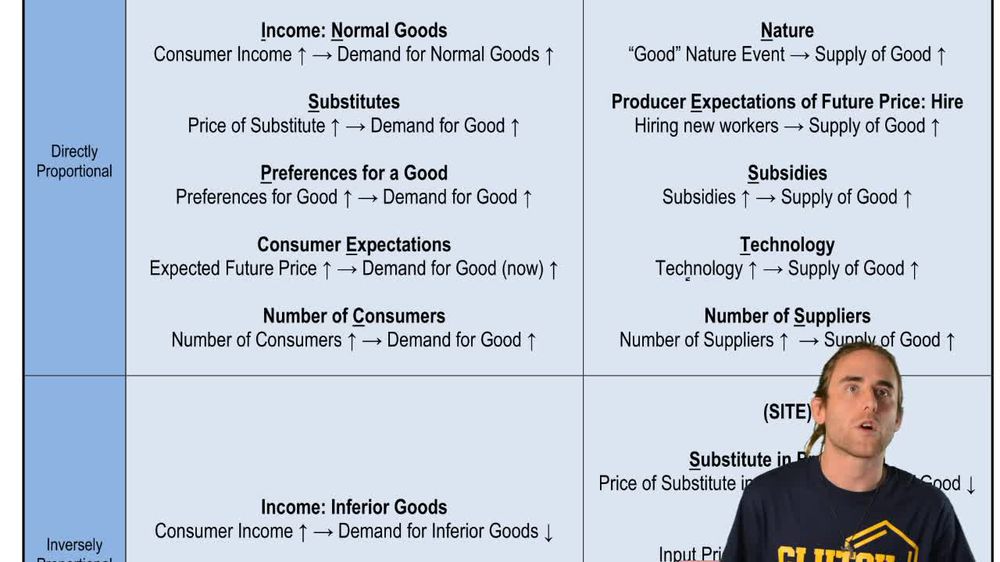
 04:05
04:05